

Question: Let the following figures represent the average weekly per-capita consumption (in USD) for a sample of 10 random Iraqi households in 2012: 9.7, 5.5, 7,
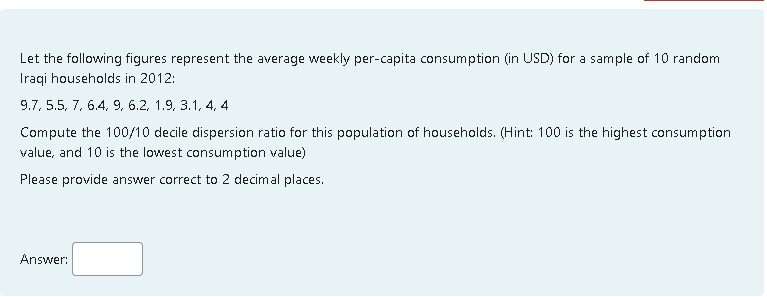
Let the following figures represent the average weekly per-capita consumption (in USD) for a sample of 10 random Iraqi households in 2012: 9.7, 5.5, 7, 6.4, 9, 6.2, 1.9, 3.1, 4, 4 Compute the 100/10 decile dispersion ratio for this population of households. (Hint: 100 is the highest consumption value, and 10 is the lowest consumption value) Please provide answer correct to 2 decimal places
Step by Step Solution
There are 3 Steps involved in it
1 Expert Approved Answer
Step: 1 Unlock

Question Has Been Solved by an Expert!
Get step-by-step solutions from verified subject matter experts
Step: 2 Unlock
Step: 3 Unlock