

Question: Let us say we know that the true likelihood that CU undergrads voted in the 2020 presidential election was 65.21% (i.e., a probability of .6521).

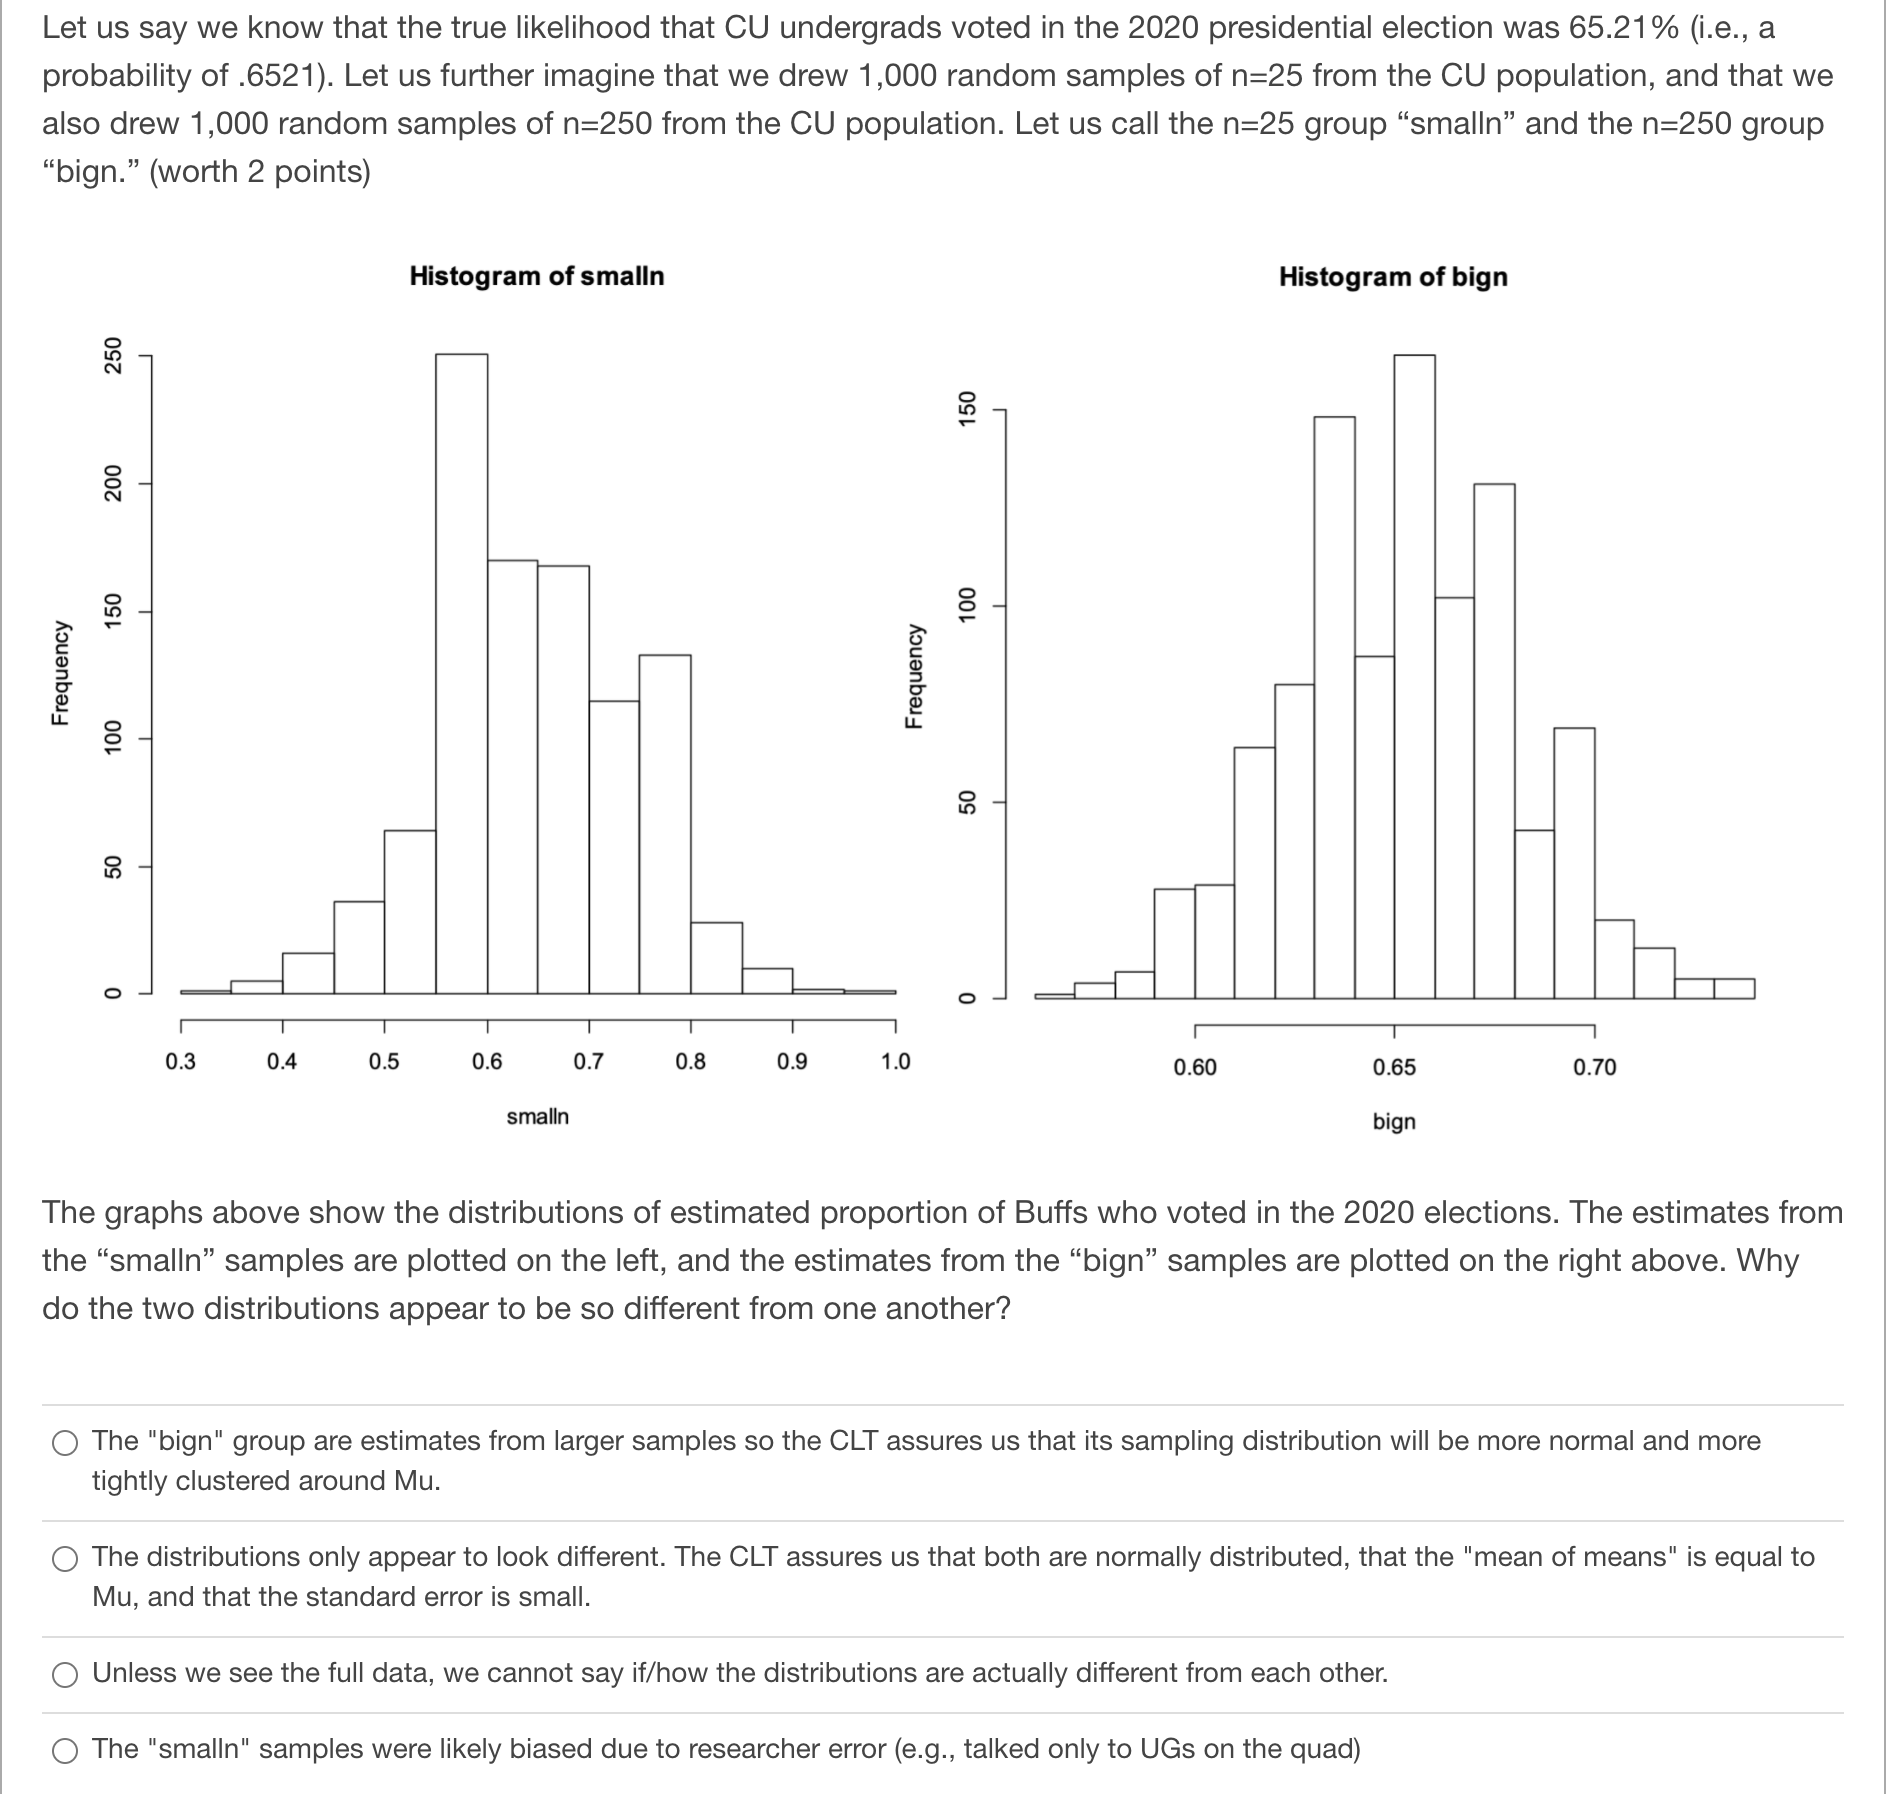
Let us say we know that the true likelihood that CU undergrads voted in the 2020 presidential election was 65.21% (i.e., a probability of .6521). Let us further imagine that we drew 1,000 random samples of n=25 from the CU population, and that we also drew 1,000 random samples of n=250 from the CU population. Let us call the n=25 group \"smalln" and the n=250 group \"bign.\" (worth 2 points) Histogram of smalln Histogram of blgn 250 150 l 200 Frequency 0 50 100 150 Frequency 50 100 I l 0.60 0.65 0.70 smalln bign The graphs above show the distributions of estimated proportion of Buffs who voted in the 2020 elections. The estimates from the \"smalln" samples are plotted on the left, and the estimates from the "bign" samples are plotted on the right above. Why do the two distributions appear to be so different from one another? 0 The "bign" group are estimates from larger samples so the CLT assures us that its sampling distribution will be more normal and more tightly clustered around Mu. O The distributions only appear to look different. The CLT assures us that both are normally distributed, that the "mean of means" is equal to Mu, and that the standard error is small. 0 Unless we see the full data, we cannot say if/how the distributions are actually different from each other. 0 The "smalln" samples were likely biased due to researcher error (e.g., talked only to UGs on the quad)
Step by Step Solution
There are 3 Steps involved in it

Get step-by-step solutions from verified subject matter experts