

Question: Let us take another look at the demand for widgets as outlined in Assignment No. 3: A B C D E F GHI J K
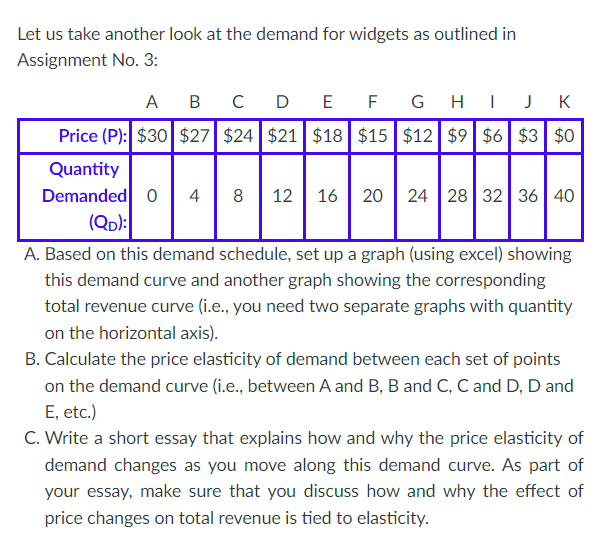
Let us take another look at the demand for widgets as outlined in Assignment No. 3: A B C D E F GHI J K Price (P):| $30 $27 $24 $21 $18 $15 $12 $9 $6 $3 $0 Quantity Demanded 0 4 8 12 16 20 24 28 32 36 40 (QD): A. Based on this demand schedule, set up a graph (using excel) showing this demand curve and another graph showing the corresponding total revenue curve (i.e., you need two separate graphs with quantity on the horizontal axis). B. Calculate the price elasticity of demand between each set of points on the demand curve (i.e., between A and B, B and C, C and D, D and E, etc.) C. Write a short essay that explains how and why the price elasticity of demand changes as you move along this demand curve. As part of your essay, make sure that you discuss how and why the effect of price changes on total revenue is tied to elasticity
Step by Step Solution
There are 3 Steps involved in it

Get step-by-step solutions from verified subject matter experts