

Question: Let x be a random variable that represents the batting average of a professional baseball player. Let y be a random variable that represents the
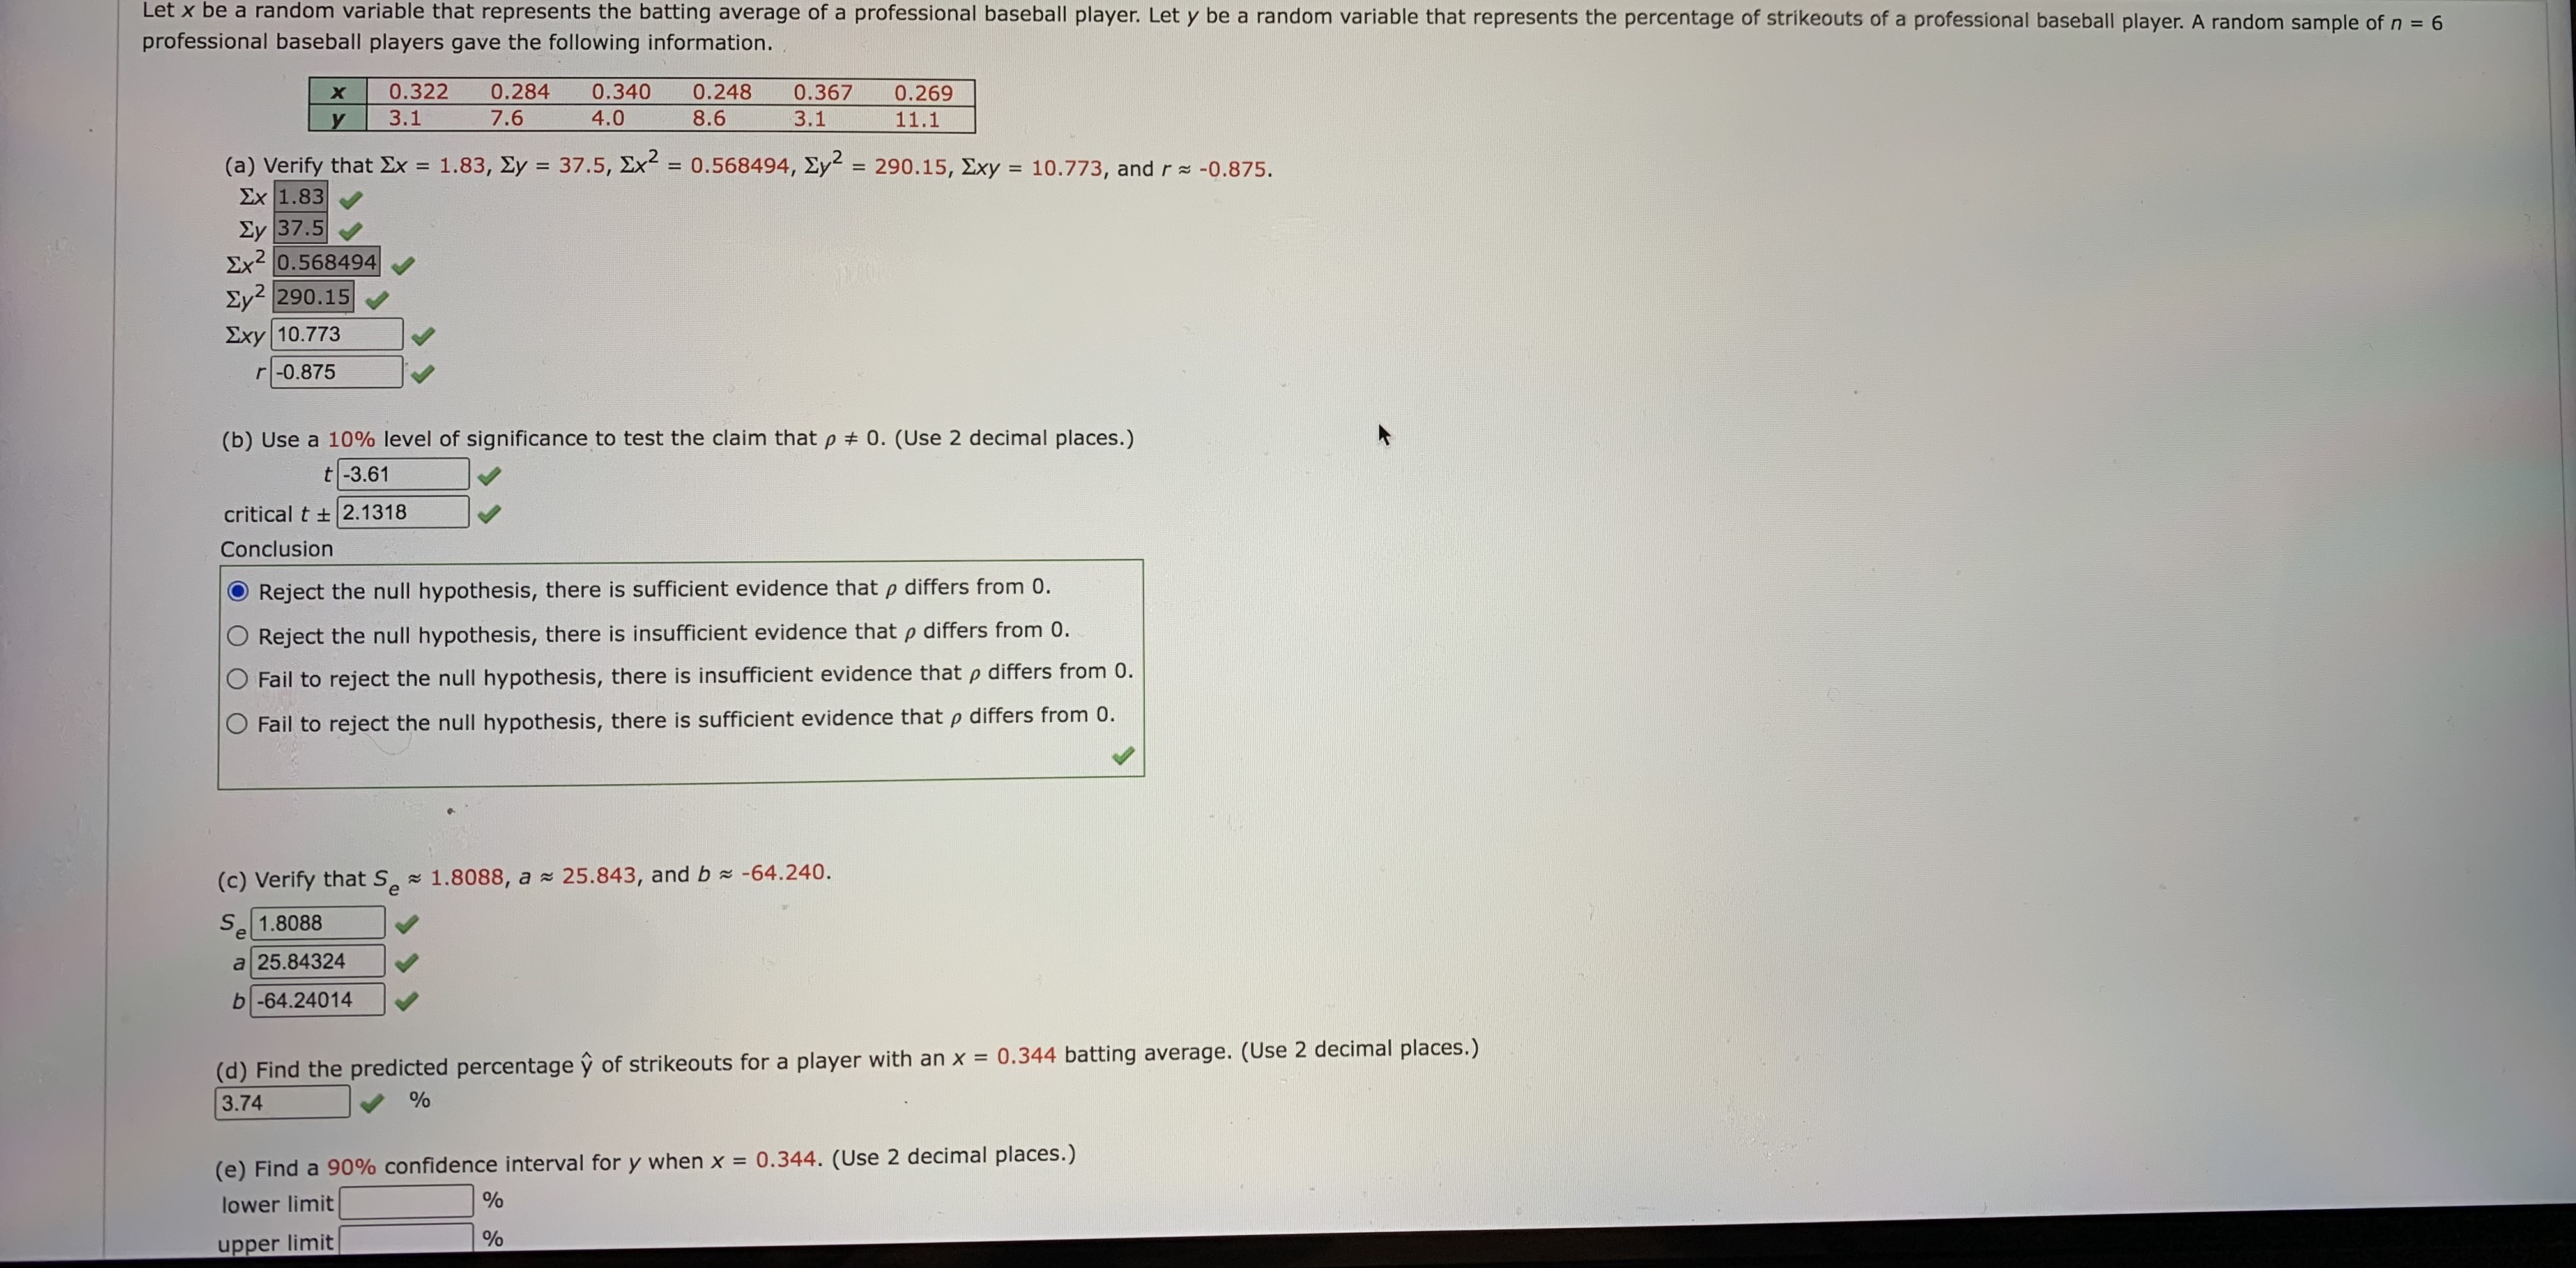
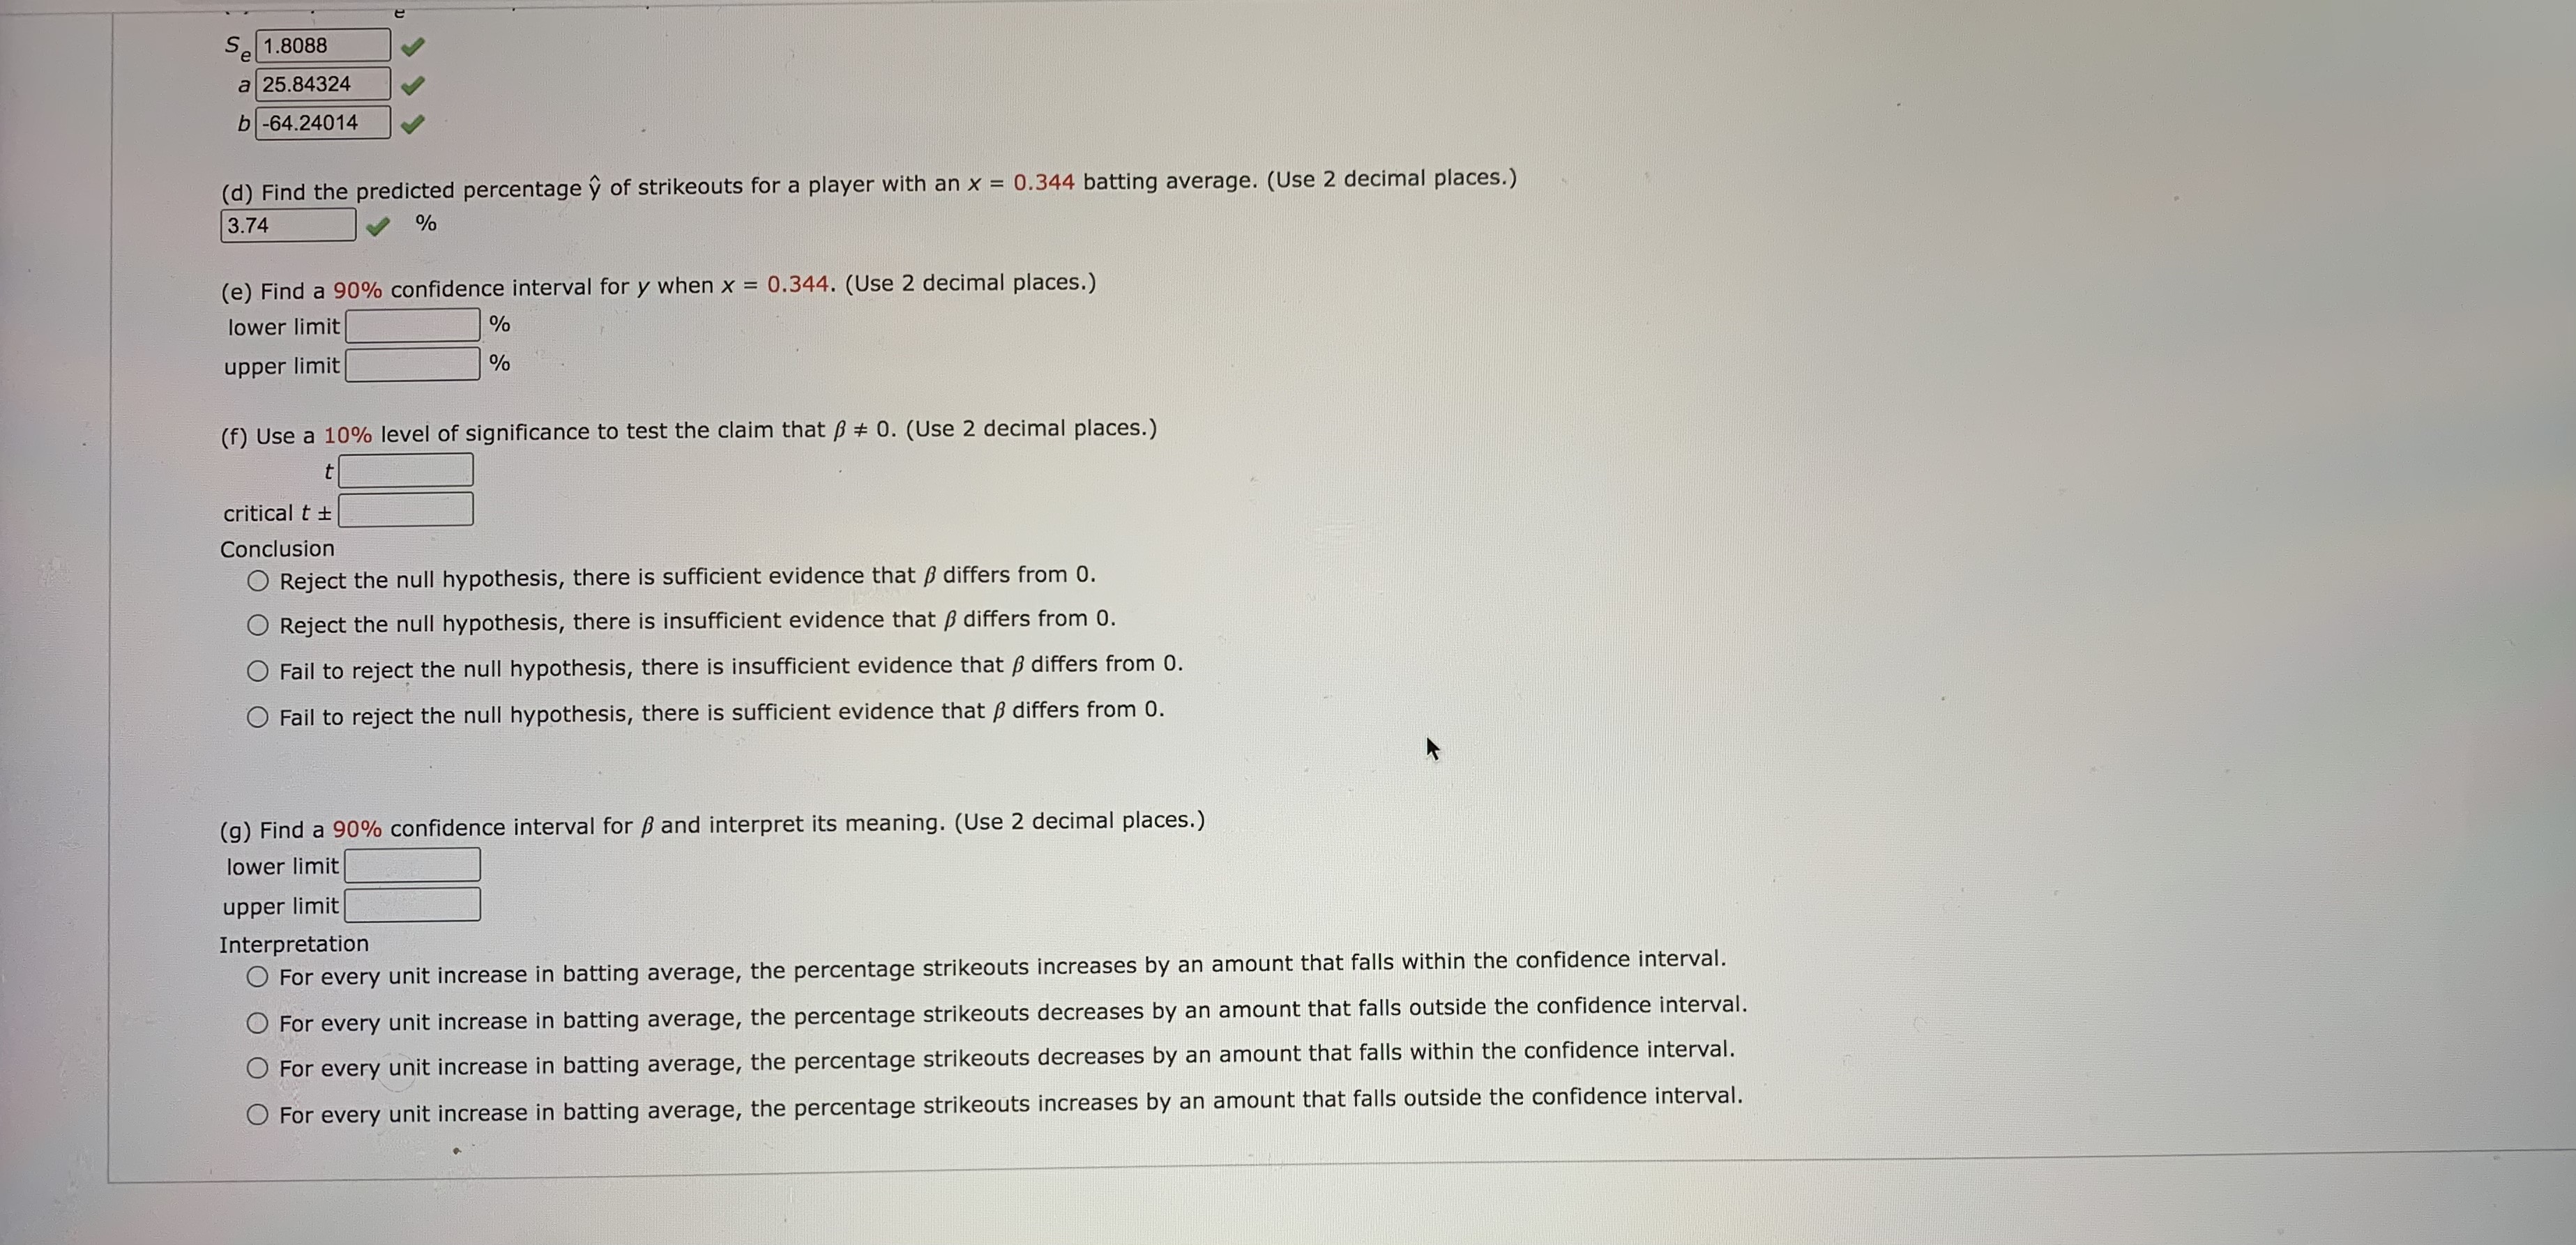
Let x be a random variable that represents the batting average of a professional baseball player. Let y be a random variable that represents the percentage of strikeouts of a professional baseball player. A random sample of n = 6 professional baseball players gave the following information. X 0.322 0.284 0.340 0.248 0.367 0.269 3.1 7.6 4.0 8.6 3.1 11.1 (a) Verify that Ex = 1.83, Zy = 37.5, Ex2 = 0.568494, Zy2 = 290.15, Exy = 10.773, and r = -0.875. Ex 1.83 Ey 37.5 Ex2 0.568494 Ey2 290.15 Exy 10.773 r -0.875 (b) Use a 10% level of significance to test the claim that p + 0. (Use 2 decimal places.) t -3.61 critical t + 2.1318 Conclusion Reject the null hypothesis, there is sufficient evidence that p differs from 0. O Reject the null hypothesis, there is insufficient evidence that p differs from 0. O Fail to reject the null hypothesis, there is insufficient evidence that p differs from 0. O Fail to reject the null hypothesis, there is sufficient evidence that p differs from 0. (c) Verify that S = 1.8088, a = 25.843, and b = -64.240. Se 1.8088 a 25.84324 b -64.24014 (d) Find the predicted percentage y of strikeouts for a player with an x = 0.344 batting average. (Use 2 decimal places.) 3.74 (e) Find a 90% confidence interval for y when x = 0.344. (Use 2 decimal places.) lower limit % upper limit1.8088 a 25.84324 b -64.24014 (d) Find the predicted percentage y of strikeouts for a player with an x = 0.344 batting average. (Use 2 decimal places.) 3.74 % (e) Find a 90% confidence interval for y when x = 0.344. (Use 2 decimal places.) lower limit % upper limit (f) Use a 10% level of significance to test the claim that p # 0. (Use 2 decimal places.) critical t + Conclusion O Reject the null hypothesis, there is sufficient evidence that B differs from 0. O Reject the null hypothesis, there is insufficient evidence that f differs from 0. O Fail to reject the null hypothesis, there is insufficient evidence that p differs from 0. O Fail to reject the null hypothesis, there is sufficient evidence that p differs from 0. (g) Find a 90% confidence interval for $ and interpret its meaning. (Use 2 decimal places.) lower limit upper limit Interpretation O For every unit increase in batting average, the percentage strikeouts increases by an amount that falls within the confidence interval. For every unit increase in batting average, the percentage strikeouts decreases by an amount that falls outside the confidence interval. For every unit increase in batting average, the percentage strikeouts decreases by an amount that falls within the confidence interval. For every unit increase in batting average, the percentage strikeouts increases by an amount that falls outside the confidence interval
Step by Step Solution
There are 3 Steps involved in it

Get step-by-step solutions from verified subject matter experts