

Question: Let X be a random variable with the distribution given by the table at right. a) (2) Draw a graph of this distribution. Would you
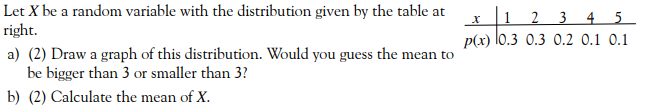
Let X be a random variable with the distribution given by the table at right.
a) (2) Draw a graph of this distribution. Would you guess the mean to be bigger than 3 or smaller than 3?
b) (2) Calculate the mean of X.
\f
Step by Step Solution
There are 3 Steps involved in it
1 Expert Approved Answer
Step: 1 Unlock

Question Has Been Solved by an Expert!
Get step-by-step solutions from verified subject matter experts
Step: 2 Unlock
Step: 3 Unlock