

Question: Let y represent the profit (or loss) for a certain company years after 1960. Based on the data shown below, a statistician calculates a
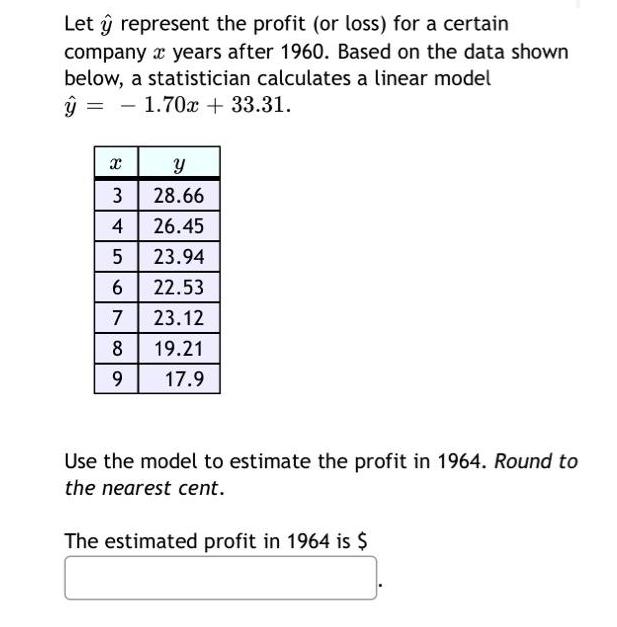
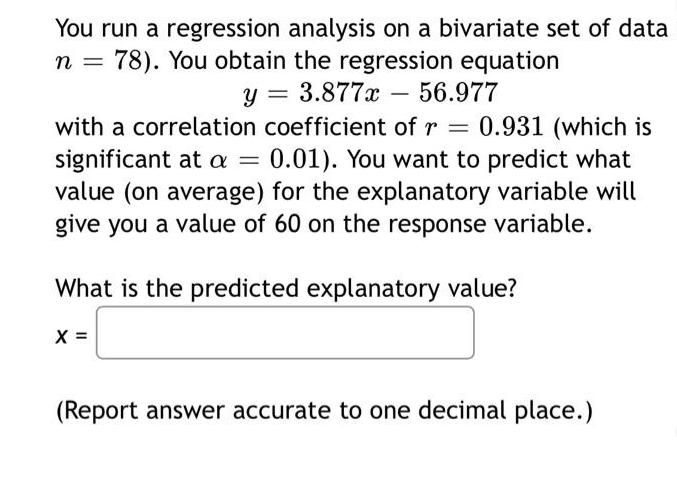
Let y represent the profit (or loss) for a certain company years after 1960. Based on the data shown below, a statistician calculates a linear model y = = 1.70x +33.31. x 3 4 5 6 7 8 9 y 28.66 26.45 23.94 22.53 23.12 19.21 17.9 Use the model to estimate the profit in 1964. Round to the nearest cent. The estimated profit in 1964 is $ You run a regression analysis on a bivariate set of data n = 78). You obtain the regression equation y = 3.877x 56.977 with a correlation coefficient of r = 0.931 (which is significant at a = 0.01). You want to predict what value (on average) for the explanatory variable will give you a value of 60 on the response variable. - What is the predicted explanatory value? X = (Report answer accurate to one decimal place.)
Step by Step Solution
3.36 Rating (159 Votes )
There are 3 Steps involved in it
Use the model to estimate the profit in 1964 Round to the nearest cent The estimated profit in 1964 ... View full answer

Get step-by-step solutions from verified subject matter experts