

Question: Let's analyze the inventory sampling data Amazon collected after the implementation of cardboard dividers. In particular, let's construct confidence intenrals to estimate the true inventory
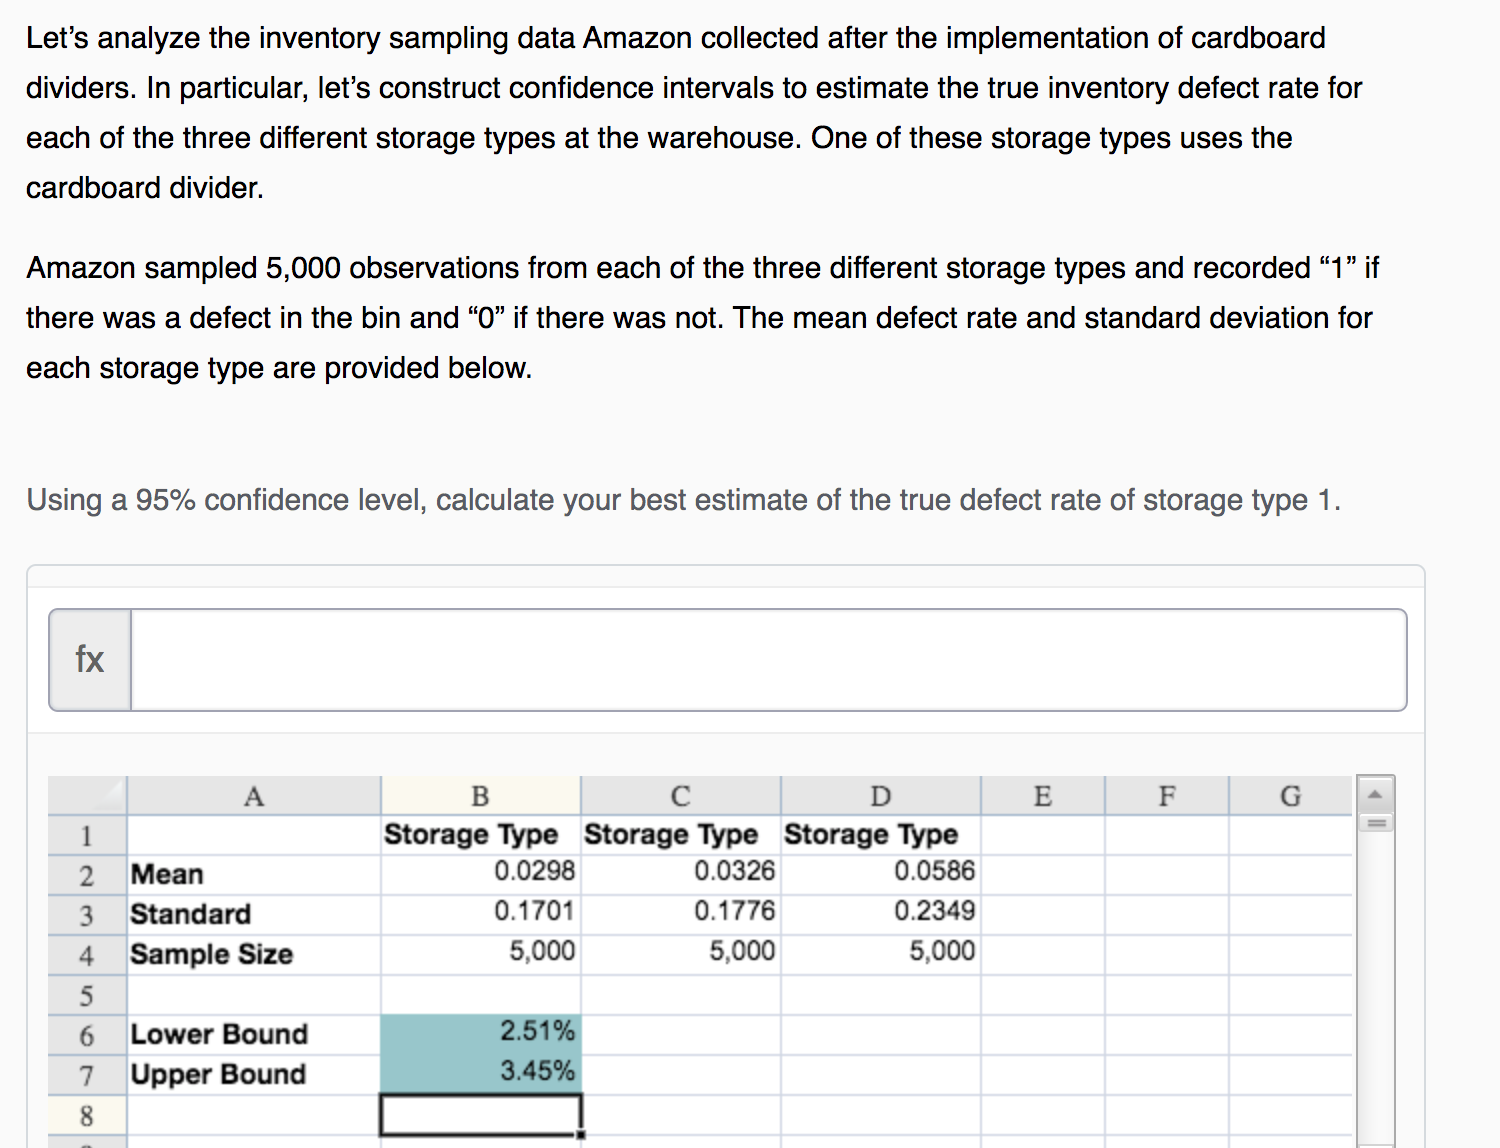
Let's analyze the inventory sampling data Amazon collected after the implementation of cardboard dividers. In particular, let's construct confidence intenrals to estimate the true inventory defect rate for each of the three different storage types at the warehouse. One of these storage types uses the cardboard divider. Amazon sampled 5,000 observations from each of the three different storage types and recorded \"1\" if there was a defect in the bin and \"0\" if there was not. The mean defect rate and standard deviation for each storage type are provided below. Using a 95% confidence level, calculate your best estimate of the true defect rate of storage type 1. 1 Storage Type Storage Type Storage Type 2 Mean 0.0290 0.0326 0.0586 3 Standard 0.1701 0.1776 0.2349 4 Sample Size 5.000 5.000 5.000 5 6 Lower Bound 7 Upper Bound 8
Step by Step Solution
There are 3 Steps involved in it

Get step-by-step solutions from verified subject matter experts