

Question: Let's describe the relation between two characteristics. Run Excel Scatter Plot and Correlation for following pair of characteristics. Q_B.3. To verify common sense (faster ball
Let's describe the relation between two characteristics. Run Excel Scatter Plot and Correlation for following pair of characteristics.
Q_B.3. To verify common sense (faster ball flies farther), check the relation between "Club Head Speed" and "Driving Distance" with Excel Scatter Plot and Correlation Coefficient. Using proper statistical terms, explain the relation between Club Head Speed and Driving Distance.
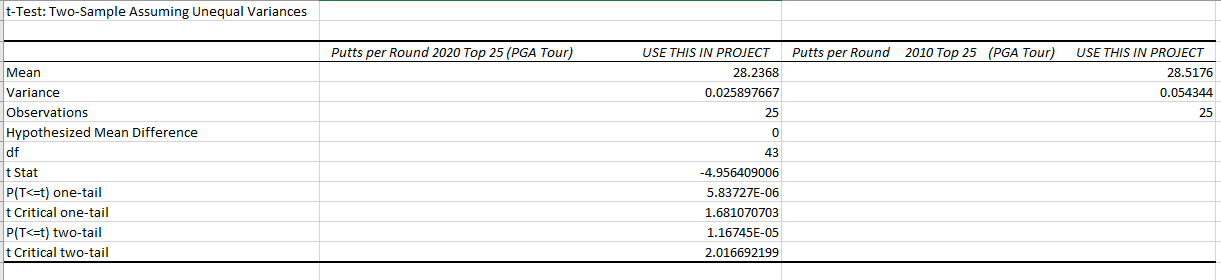
Q_B.4. Check the relation between "Club Head Speed" and "Driving Accuracy %" with Excel Scatter Plot and Correlation Coefficient. Using proper statistical terms, explain the relation between "Club Head Speed" and "Driving Accuracy %".
Have you observed approximately linear pattern from the scatter plots? Let's check more details on the relation. Using this data, consider the equation of the regression line,
y=b0+b1x, for predicting the Driving Distance based on Club Head Speed.
Double check which (driving distance vs. club head speed) is X, which is Y. Critical!
(Assumptions about error term in simple linear regression are known to be satisfied).
Run Excel "regression" to predict Driving Distance based on Club Head Speed. Review output and answer following questions.
Q_B.5. Find the estimated y-intercept and estimated slope. Round your answer to three decimal places.
- y-intercept:
- slope:
Q_B.6. Write down the equation of the regression line, using the values in questions Q_B.4 and Q_B. 5. 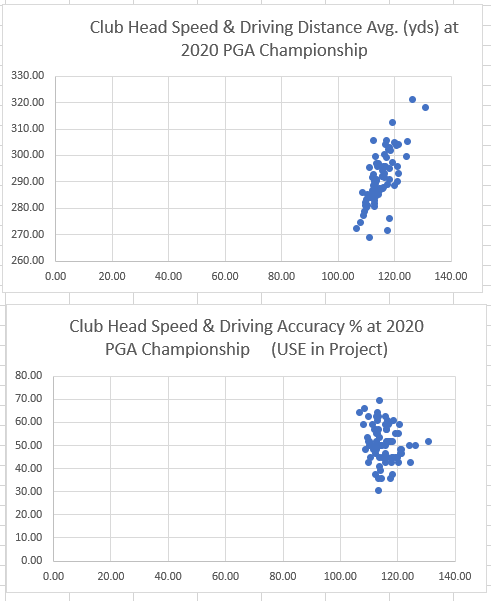


Step by Step Solution
There are 3 Steps involved in it

Get step-by-step solutions from verified subject matter experts