

Question: Let's go back in a time machine to the early 2006. You just read this in an equity research report about TransDigm, a company that
Let's go back in a time machine to the early 2006. You just read this in an equity research report about TransDigm, a company that has recently gone public. (TransDigm manufacturers aerospace components and subsystems and has grown revenue and EBITDA more than 20% in recent years through a combination of internal growth and acquisitions.
11a. Explain how TransDigm is valued relative to the four other comparable companies in terms of range and median multiples. (Don't bother looking up what companies these are; just take at face value that they are comparable). Include all of the multiples you think are relevant (there should be four, two for each year). Show a table summarizing these figures and also interpret what you see. This is a quantitative and qualitative question. (1 point)
11b. Explain how and why the equity research team has set a price target of $29.00 per share in the next year. Specifically, walk through the "math" of how they get to this target and explain why they think this is valuation is justified. (1 point)
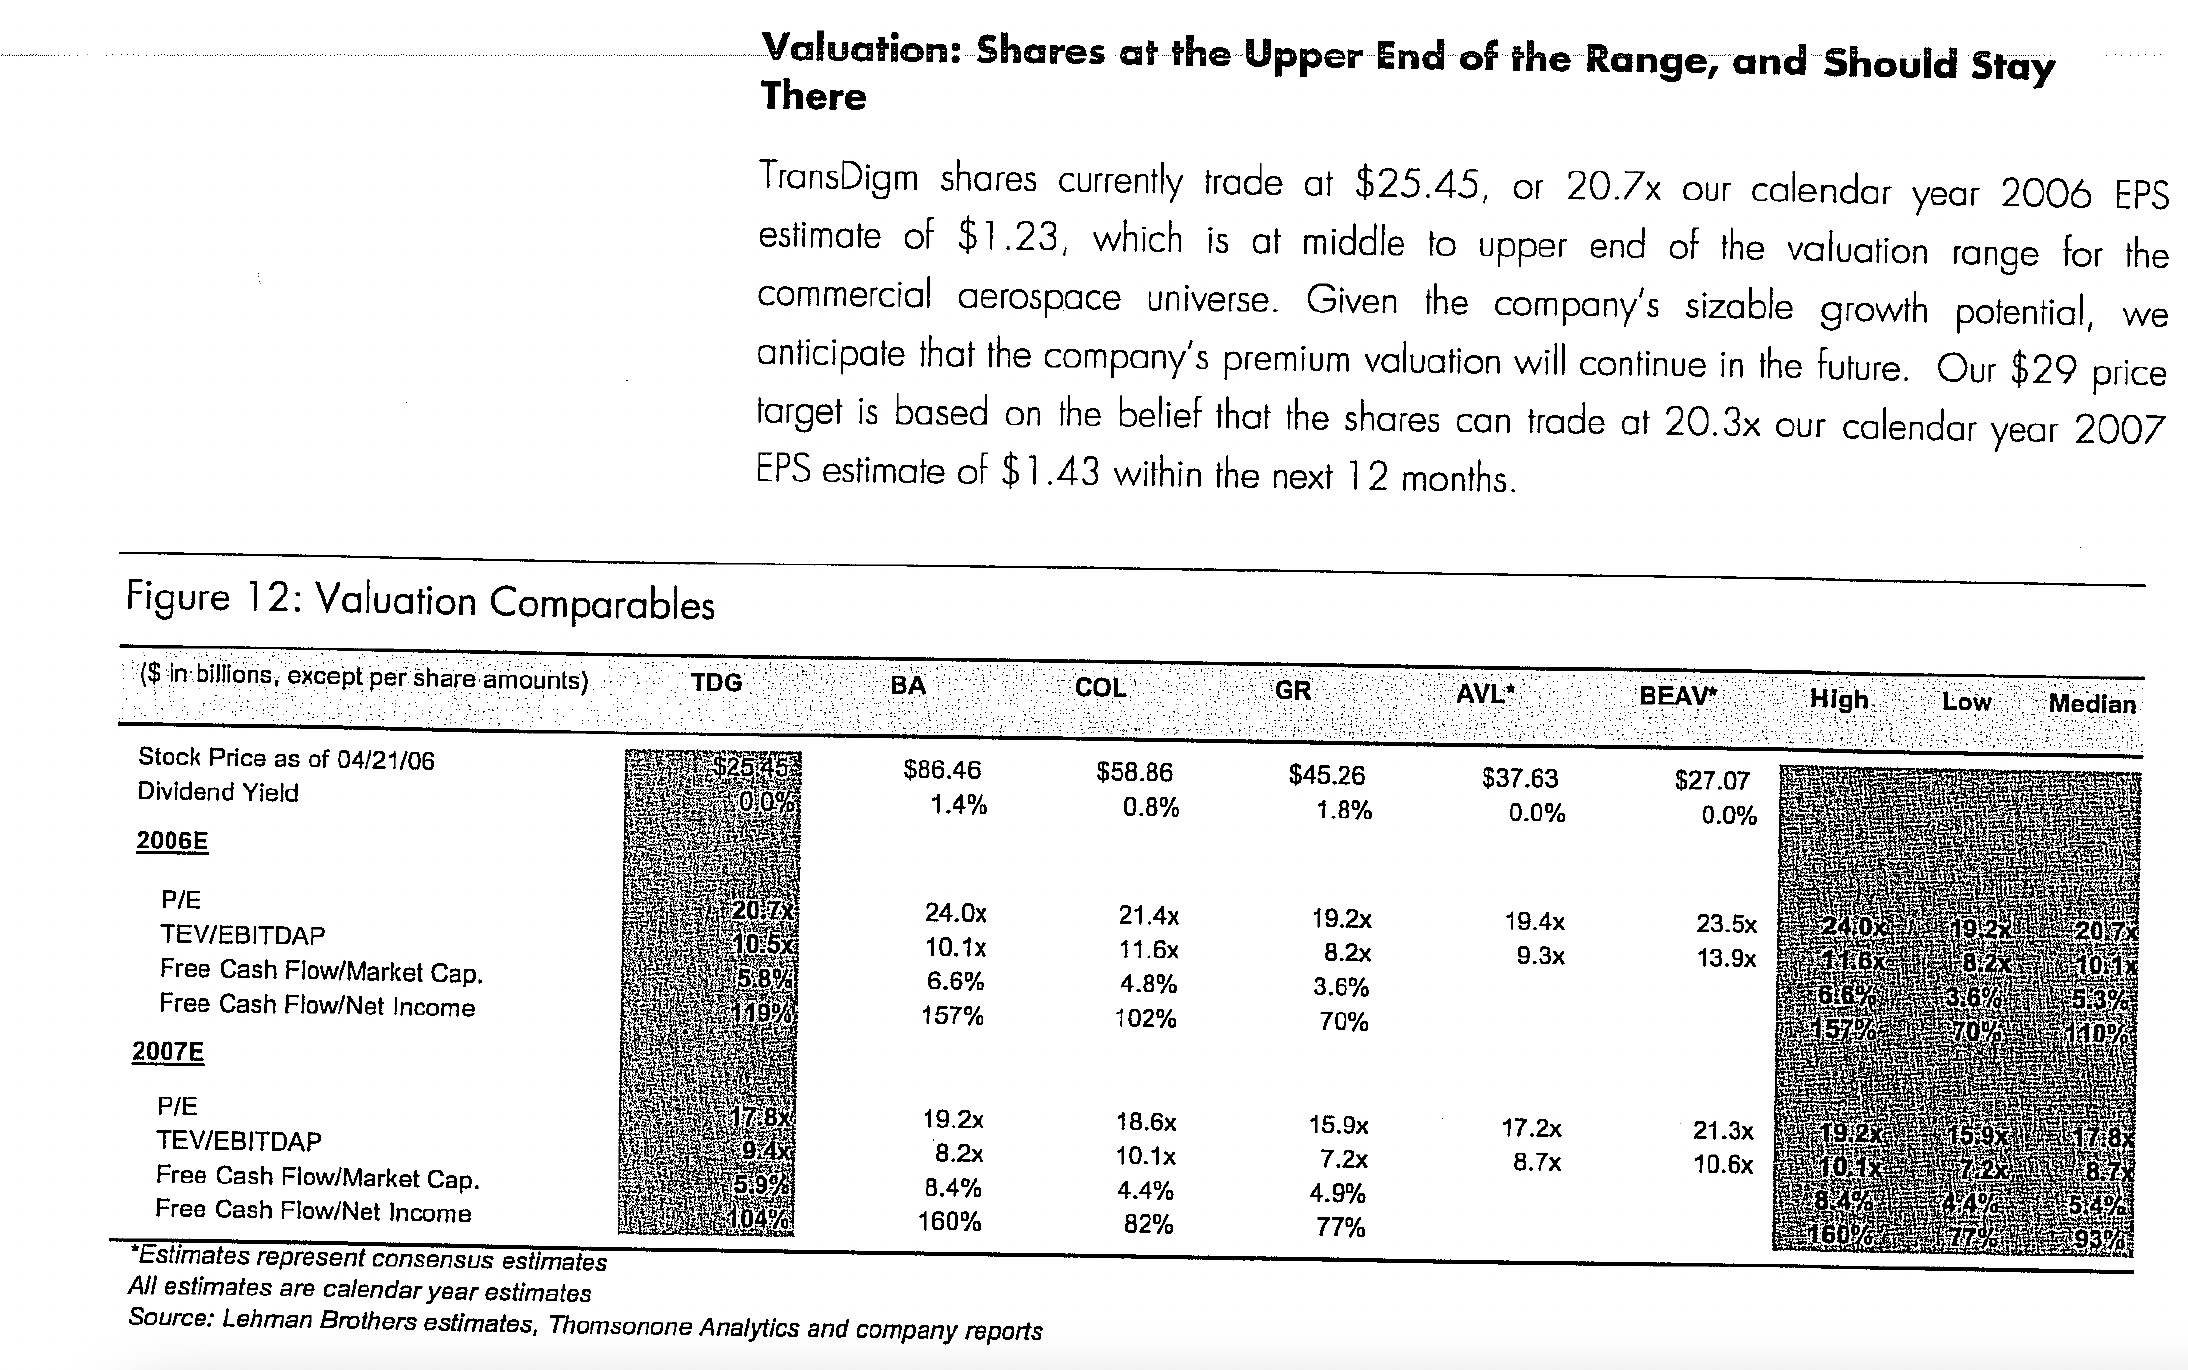
Figure 12: Valuation Comparables ($ in billions, except per share amounts) Valuation: Shares at the Upper End of the Range, and Should Stay There TransDigm shares currently trade at $25.45, or 20.7x our calendar year 2006 EPS estimate of $1.23, which is at middle to upper end of the valuation range for the commercial aerospace universe. Given the company's sizable growth potential, we anticipate that the company's premium valuation will continue in the future. Our $29 price target is based on the belief that the shares can trade at 20.3x our calendar year 2007 EPS estimate of $1.43 within the next 12 months. TDG BA Stock Price as of 04/21/06 Dividend Yield _COL_ GR AVL* BEAV High Low Median $86.46 $58.86 $45.26 1.4% 0.8% 1.8% $37.63 0.0% $27.07 0.0% 2006E P/E 24.0x 21.4x 19.2x 19.4x 23.5x TEV/EBITDAP 10.1x 11.6x 8.2x 9.3x 13.9x Free Cash Flow/Market Cap. 6.6% 4.8% 3.6% Free Cash Flow/Net Income 157% 102% 70% 2007E P/E TEV/EBITDAP Free Cash Flow/Market Cap. Free Cash Flow/Net Income *Estimates represent consensus estimates All estimates are calendar year estimates 19.2x 18.6x 15.9x 17.2x 21.3x 8.2x 10.1x 7.2x 8.7x 10.6x 8.4% 4.4% 4.9% 160% 82% 77% Source: Lehman Brothers estimates, Thomsonone Analytics and company reports
Step by Step Solution
There are 3 Steps involved in it
Answer To explain how TransDigm is valued relative to the four other comparable companies in terms o... View full answer

Get step-by-step solutions from verified subject matter experts
Document Format (2 attachments)
6642b3ec61d2d_975661.pdf
180 KBs PDF File
6642b3ec61d2d_975661.docx
120 KBs Word File