

Question: Let's say we conducted a study to determine the predictors of mortality among adults in an intensive care unit (ICU). We collect the vital status
Let's say we conducted a study to determine the predictors of mortality among adults in an intensive care unit (ICU). We collect the vital status (STA) of 200 individuals; STA is coded as 0 if the individual "Lived" and 1 if the individual "Died". Data on potential predictors were also collected including age (in years), presence of cancer (CAN, coded as 0=No and 1=Yes), CPR prior to ICU admission (CPR, coded as 0=No and 1=Yes), probable infection at ICU admission (INF, coded as 0=N0 and 1=Yes). We analyze the data using SAS's LOGISTIC procedure and observe the results shown in Table 2. Based on those findings, answer the following questions.
3. Report the odds ratios and 95% confidence intervals for all four independent variables. Based on those confidence intervals, which of the independent variables are significant predictors of vital status in the ICU and which ones are not significant predictors? What's the reason for your decisions.
4. Report p-values of all four independent variables using "Analysis of Maximum Likelihood Estimates" table in the SAS output. Based on the p-values, which of the independent variables are significant predictors for the virtual status in the ICU and which ones are not significant predictors? Be sure to include the reasoning for your decisions. Compare with question 3.
5. Discuss what these findings mean from public health perspective.
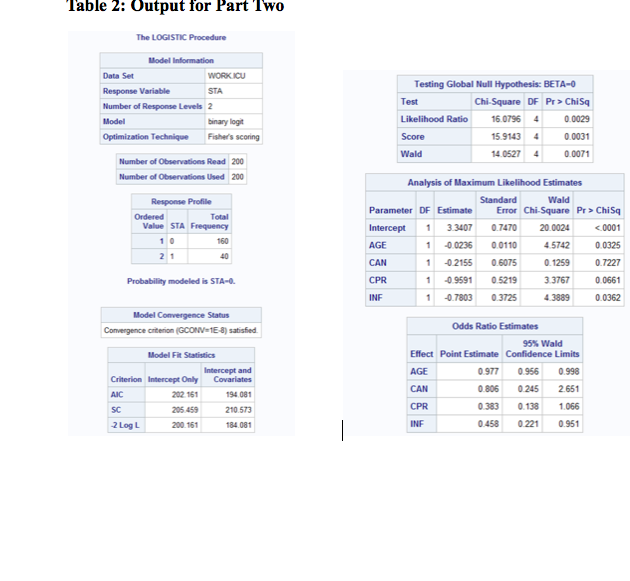
Table 2: Output for Part Two The LOGISTIC Procedure Model Information Data Set WORK.ICU Response Variable STA Testing Global Null Hypothesis: BETA-0 Number of Response Levels 2 Test Chi-Square OF Pr > ChiSq Model binary logit Likelihood Ratio 16.0796 4 0.0029 Optimization Technique Fisher's scoring Score 15.9143 4 0.0031 Wald 14 0527 4 0.0071 Number of Observations Road 200 Number of Observations Used 200 Analysis of Maximum Likelihood Estimates Response Profile Standard Wald Ordered Parameter OF Estimate Error Chi-Square Pr > ChiSq Value STA Frequency Intercept 3 3407 0.7470 20.0024 0001 160 AGE 1 -0 0235 0.0110 4 5742 0 032 21 CAN 1 0.2155 0.6075 0.1259 0.7227 Probability modeled is STA-0. CPR 1 -0 9591 0.5219 3.3767 0.0561 INF 1 -0.7803 0.3725 13869 0.0362 Model Convergence Status Convergence criterion (GCONV= 15-8) satisfied Odds Ratio Estimates 95% Wald Model Fit Statistics Effect Point Estimate Confidence Limits Intercept and AGE 0.977 0.956 0.998 Criterion Intercept Only Covariates 302 151 194.081 CAN 0.806 0.245 2.651 AIC SC 205 459 210.573 CPR 0 383 0. 138 1.066 -2 Log L 200.151 184.081 INF 0.458 0.221 0.951
Step by Step Solution
There are 3 Steps involved in it

Get step-by-step solutions from verified subject matter experts