Question: Level 2 - Analyzing Demographic Data for La Rosa Restaurant You have recently decided to open a restaurant that you plan to name La Rosa.
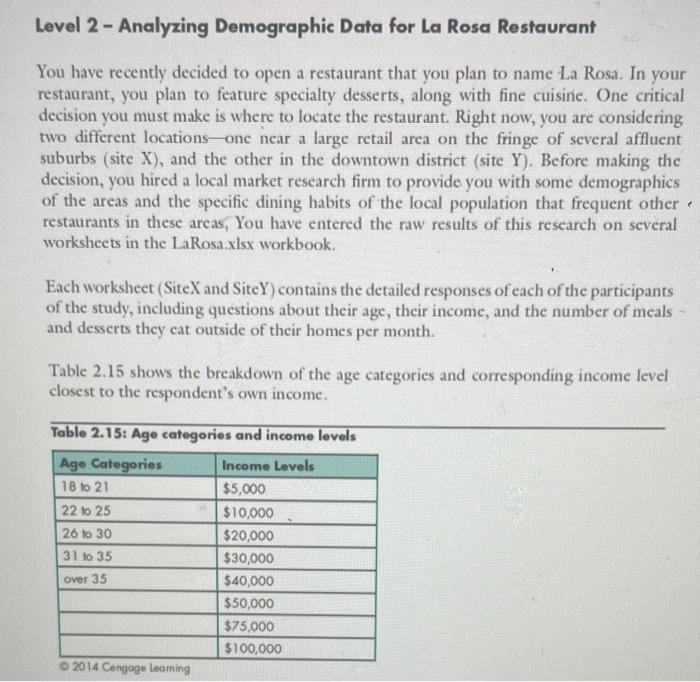
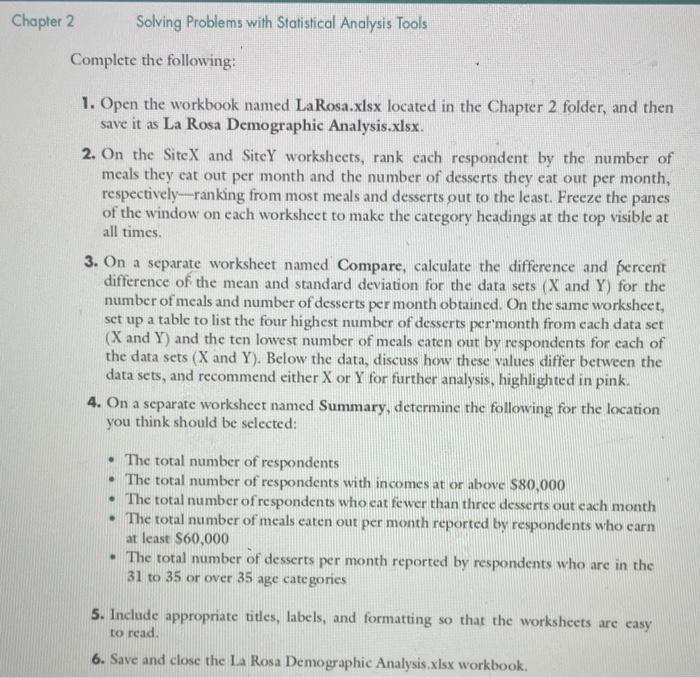
Level 2 - Analyzing Demographic Data for La Rosa Restaurant You have recently decided to open a restaurant that you plan to name La Rosa. In your restaurant, you plan to feature specialty desserts, along with fine cuisine. One critical decision you must make is where to locate the restaurant. Right now, you are considering two different locations one near a large retail area on the fringe of several affluent suburbs (site X), and the other in the downtown district (site Y). Before making the decision, you hired a local market research firm to provide you with some demographics of the areas and the specific dining habits of the local population that frequent other restaurants in these areas, You have entered the raw results of this research on several worksheets in the LaRosa.xlsx workbook. Each worksheet (SiteX and SiteY) contains the detailed responses of each of the participants of the study, including questions about their age, their income, and the number of meals and desserts they eat outside of their homes per month Table 2.15 shows the breakdown of the age categories and corresponding income level closest to the respondent's own income. Table 2.15: Age categories and income levels Age Categories Income Levels 18 to 21 $5,000 22 to 25 $10,000 26 to 30 $20,000 31 to 35 $30,000 $40,000 $50,000 $75,000 $100,000 2014 Cengage Leaming over 35 Chapter 2 Solving Problems with Statistical Analysis Tools Complete the following: 1. Open the workbook named LaRosa.xlsx located in the Chapter 2 folder, and then save it as La Rosa Demographic Analysis.xlsx. 2. On the SiteX and SiteY worksheets, rank cach respondent by the number of meals they cat out per month and the number of desserts they eat out per month, respectively-ranking from most meals and desserts out to the least. Freeze the panes of the window on each worksheet to make the category headings at the top visible at all times. 3. On a separate worksheet named Compare, calculate the difference and percent difference of the mean and standard deviation for the data sets (X and Y) for the number of meals and number of desserts per month obtained. On the same worksheet, set up a table to list the four highest number of desserts per month from each data set (X and Y) and the ten lowest number of meals eaten out by respondents for each of the data sets (X and Y). Below the data, discuss how these values differ between the data sets, and recommend either X or Y for further analysis, highlighted in pink. 4. On a separate worksheet named Summary, determine the following for the location you think should be selected: The total number of respondents The total number of respondents with incomes at or above $80,000 The total number of respondents who eat fewer than three desserts out each month The total number of meals eaten out per month reported by respondents who earn at least S60,000 The total number of desserts per month reported by respondents who are in the 31 to 35 or over 35 age categories 5. Include appropriate titles, labels, and formatting so that the worksheets are easy to read, 6. Save and close the La Rosa Demographic Analysis xlsx workbook. Level 2 - Analyzing Demographic Data for La Rosa Restaurant You have recently decided to open a restaurant that you plan to name La Rosa. In your restaurant, you plan to feature specialty desserts, along with fine cuisine. One critical decision you must make is where to locate the restaurant. Right now, you are considering two different locations one near a large retail area on the fringe of several affluent suburbs (site X), and the other in the downtown district (site Y). Before making the decision, you hired a local market research firm to provide you with some demographics of the areas and the specific dining habits of the local population that frequent other restaurants in these areas, You have entered the raw results of this research on several worksheets in the LaRosa.xlsx workbook. Each worksheet (SiteX and SiteY) contains the detailed responses of each of the participants of the study, including questions about their age, their income, and the number of meals and desserts they eat outside of their homes per month Table 2.15 shows the breakdown of the age categories and corresponding income level closest to the respondent's own income. Table 2.15: Age categories and income levels Age Categories Income Levels 18 to 21 $5,000 22 to 25 $10,000 26 to 30 $20,000 31 to 35 $30,000 $40,000 $50,000 $75,000 $100,000 2014 Cengage Leaming over 35 Chapter 2 Solving Problems with Statistical Analysis Tools Complete the following: 1. Open the workbook named LaRosa.xlsx located in the Chapter 2 folder, and then save it as La Rosa Demographic Analysis.xlsx. 2. On the SiteX and SiteY worksheets, rank cach respondent by the number of meals they cat out per month and the number of desserts they eat out per month, respectively-ranking from most meals and desserts out to the least. Freeze the panes of the window on each worksheet to make the category headings at the top visible at all times. 3. On a separate worksheet named Compare, calculate the difference and percent difference of the mean and standard deviation for the data sets (X and Y) for the number of meals and number of desserts per month obtained. On the same worksheet, set up a table to list the four highest number of desserts per month from each data set (X and Y) and the ten lowest number of meals eaten out by respondents for each of the data sets (X and Y). Below the data, discuss how these values differ between the data sets, and recommend either X or Y for further analysis, highlighted in pink. 4. On a separate worksheet named Summary, determine the following for the location you think should be selected: The total number of respondents The total number of respondents with incomes at or above $80,000 The total number of respondents who eat fewer than three desserts out each month The total number of meals eaten out per month reported by respondents who earn at least S60,000 The total number of desserts per month reported by respondents who are in the 31 to 35 or over 35 age categories 5. Include appropriate titles, labels, and formatting so that the worksheets are easy to read, 6. Save and close the La Rosa Demographic Analysis xlsx workbook