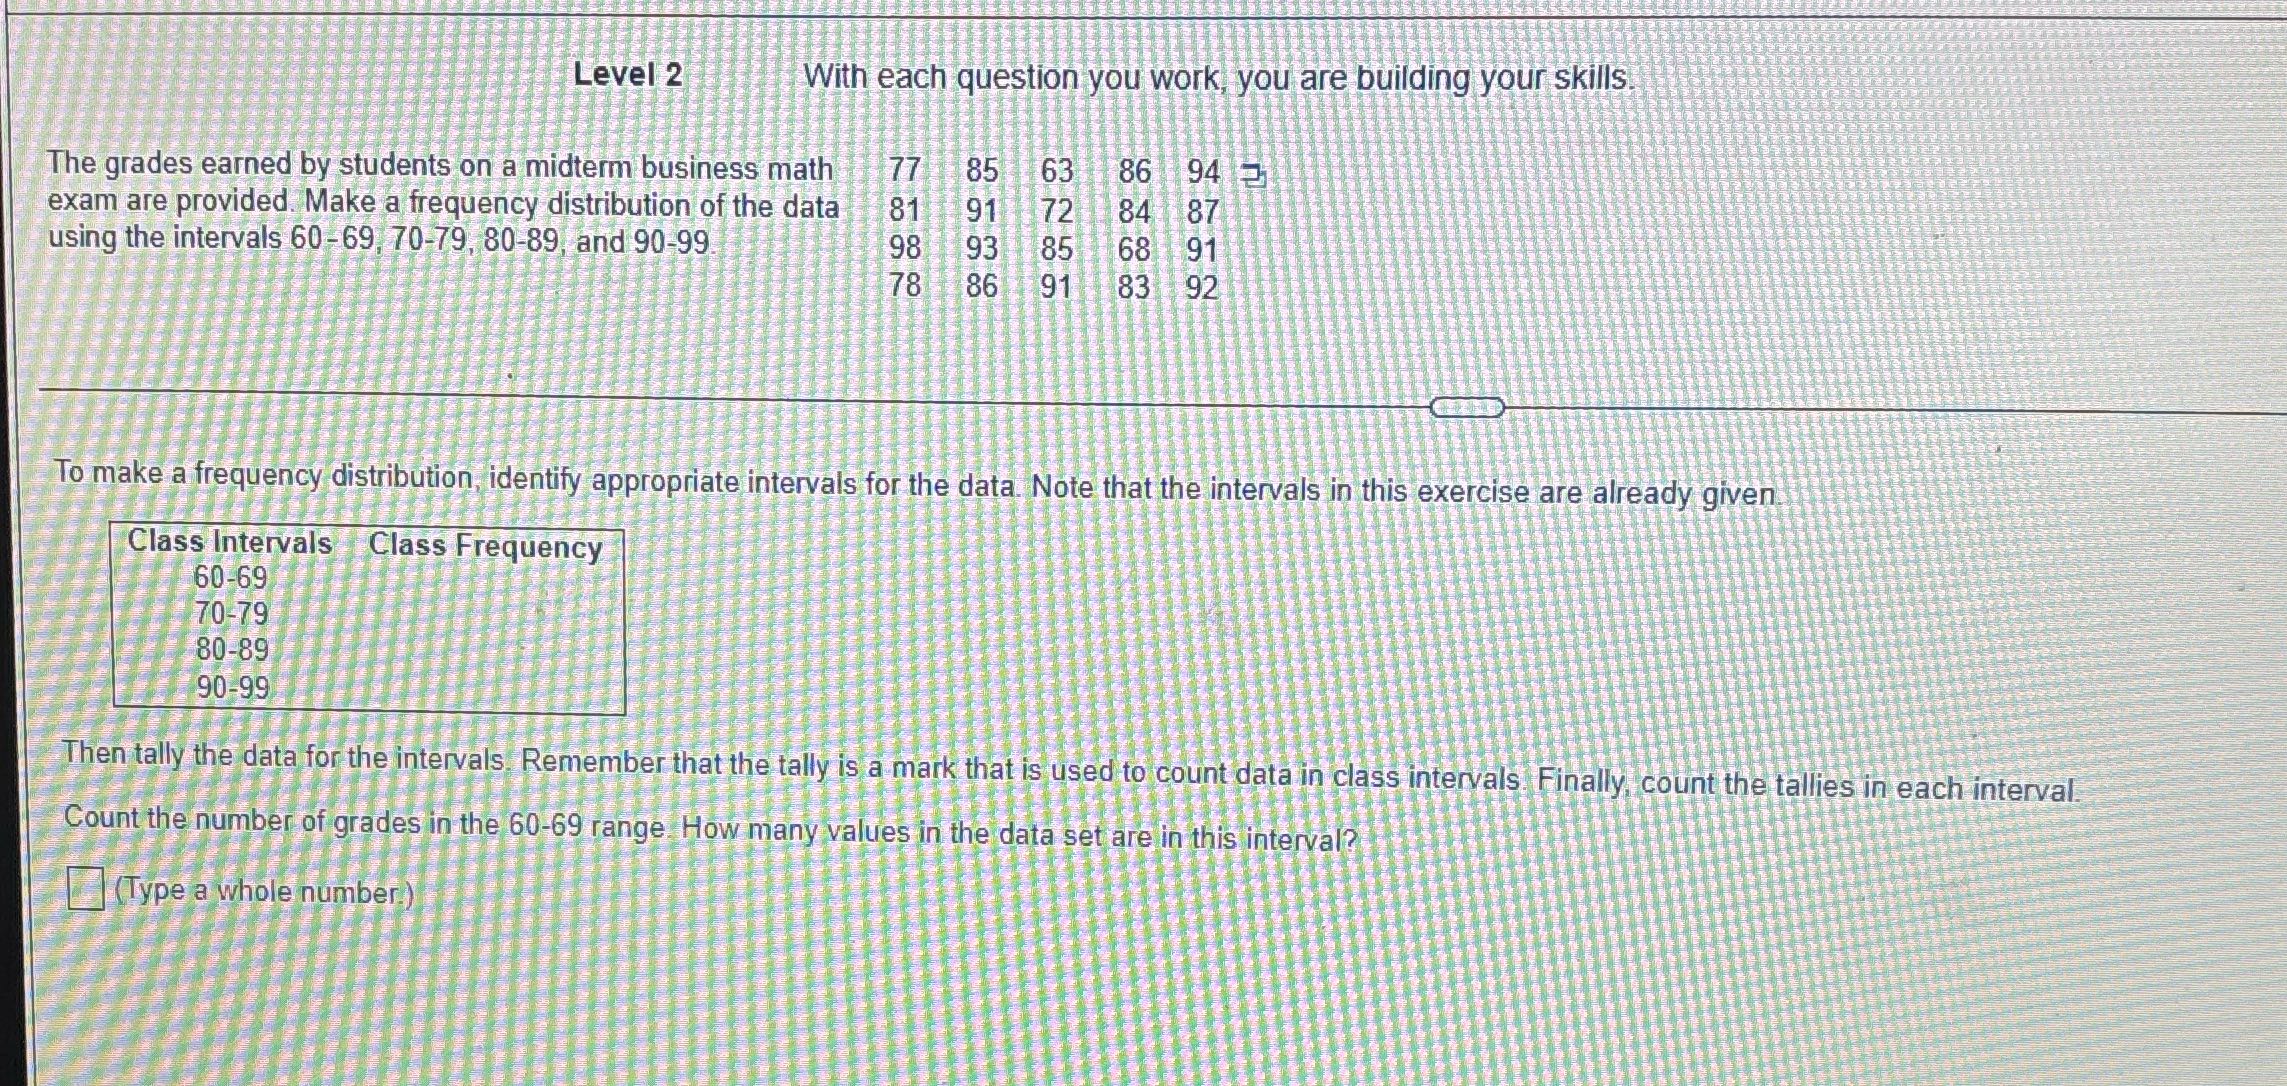
Question: Level 2 With each question you work, you are building your skills, The grades earned by students on a midterm business math 77 85 63

Level 2 With each question you work, you are
Level 2 With each question you work, you are building your skills, The grades earned by students on a midterm business math 77 85 63 86 94 exam are provided. Make a frequency distribution of the data 81 91 72 84 87 using the intervals 60-69, 70-79, 80-89, and 90-99. 98 93 68 91 78 86 91 83 92 To make a frequency distribution, identify appropriate intervals for the data. Note that the intervals in this exercise are already given Class Intervals Class Frequency 60-69 70-79 80-89 90-99 Then tally the data for the intervals. Remember that the tally is a mark that is used to count data in class intervals. Finally, count the tallies in each interval. Count the number of grades in the 60-69 range. How many values in the data set are in this interval? (Type a whole number.)

Step by Step Solution

There are 3 Steps involved in it

1 Expert Approved Answer
Step: 1 Unlock blur-text-image
Question Has Been Solved by an Expert!

Get step-by-step solutions from verified subject matter experts

Step: 2 Unlock
Step: 3 Unlock

Students Have Also Explored These Related Accounting Questions!