

Level Curves B Level Curves and Contour Map One of the most useful and common methods...
Fantastic news! We've Found the answer you've been seeking!
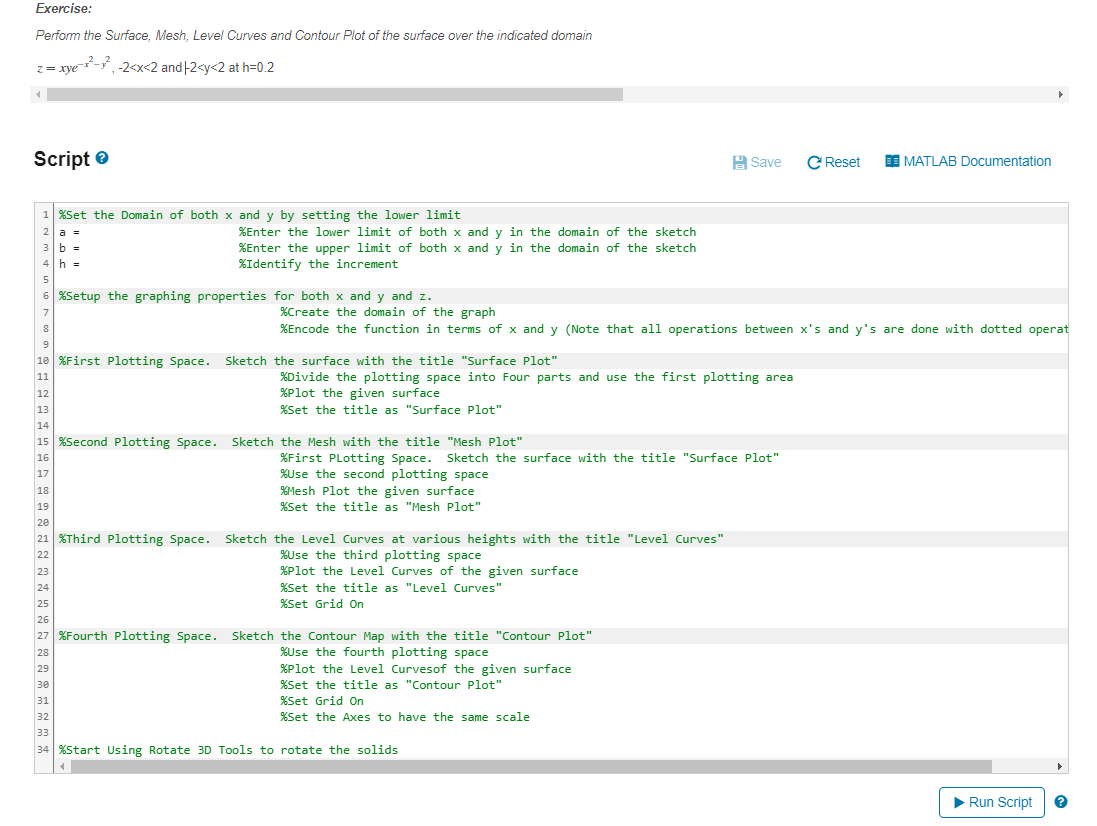
Question:

Transcribed Image Text:
Level Curves B Level Curves and Contour Map One of the most useful and common methods for visualizing functions (or surfaces) of two varibles is a Contour Map in which points of constant elevation are joined in a 2D plane to form level curves (or contour curves). Definition: The level curves of a function f of two variables are the curves with equations f(x, y) =k, where k is a constant (in the range of f). A level curve f(x,y) = k is the set of all points in the domain off at which f takes on a given value k. In other words, it shows where the graph of f has height k. You can see from the picture below (Figure 1) the relation between level curves and horizontal traces. The level curves f(x, y) =k are just the traces of the graph off in the horizontal plane z k projected down to the xy-plane. Demonstration a = -1; b = 1; h = 0.1; [x, y] = meshgrid(a:h:b); z = 9-x.^2-2*y.^2 subplot (2,1,1); surf(x,y,z); title("Surface Plot"); subplot (2,2,2); mesh (x,y,z); title("Mesh Plot"); subplot (2,2,3); contour3(x, y, z); title("Level Curves"); grid on subplot (2,2,4); contour(x,y,z); title("Contour Plot"); axis equal grid on %Enter the lower limit of both x and y in the domain of the sketch %Enter the upper limit of both x and y in the domain of the sketch %Identify the limit %Create the domain of the graph %Encode the function in terms of x and y (Note that all operations between x's and y's are done with dotted operationF1 %Plot the given surface %Set the title as "Surface Plot" %Use the second plotting space %Mesh Plot the given surface % Set the title as "Mesh Plot" %Use the third plotting space %Plot the Level Curves of the given surface % Set the title as "Level Curves" %Use the fourth plotting space %Plot the Level Curvesof the given surface %Set the title as "Contour Plot" %Set the x axis and y axis to have the same scale My Solutions > % Start Using Rotate 3D Tools to rotate the solids Exercise: Perform the Surface, Mesh, Level Curves and Contour Plot of the surface over the indicated domain z = xye-²-², -2<x<2 and -2<y<2 at h=0.2 Exercise: Perform the Surface, Mesh, Level Curves and Contour Plot of the surface over the indicated domain z = xye-²-², -2<x<2 and -2<y<2 at h=0.2 Script %Set the Domain of both x and y by setting the lower limit 2 a = 3 b = 4 h = 5 6 %Setup the graphing properties for both x and y and z. 7 8 9 10 %First Plotting Space. Sketch the surface with the title "Surface Plot" 11 12 13 %Enter the lower limit of both x and y in the domain of the sketch %Enter the upper limit of both x and y in the domain of the sketch %Identify the increment 28 28 29 14 15 %Second Plotting Space. Sketch the Mesh with the title "Mesh Plot" 16 17 18 19 20 21 %Third Plotting Space. Sketch the Level Curves at various heights with the title "Level Curves" %Use the third plotting space 22 30 31 %Divide the plotting space into Four parts and use the first plotting area %Plot the given surface % Set the title as "Surface Plot" %Create the domain of the graph %Encode the function in terms of x and y (Note that all operations between x's and y's are done with dotted operat 23 24 23 25 26 27 %Fourth Plotting Space. Sketch the Contour Map with the title "Contour Plot" %Use the fourth plotting space %Plot the Level Curvesof the given surface %Set the title as "Contour Plot" %First Plotting Space. Sketch the surface with the title "Surface Plot" %Use the second plotting space %Mesh Plot the given surface % Set the title as "Mesh Plot" %Plot the Level Curves of the given surface % Set the title as "Level Curves" % Set Grid On Save %Set Grid On %Set the Axes to have the same scale 32 33 34 % Start Using Rotate 3D Tools to rotate the solids C Reset MATLAB Documentation ▶ Run Script ? Level Curves B Level Curves and Contour Map One of the most useful and common methods for visualizing functions (or surfaces) of two varibles is a Contour Map in which points of constant elevation are joined in a 2D plane to form level curves (or contour curves). Definition: The level curves of a function f of two variables are the curves with equations f(x, y) =k, where k is a constant (in the range of f). A level curve f(x,y) = k is the set of all points in the domain off at which f takes on a given value k. In other words, it shows where the graph of f has height k. You can see from the picture below (Figure 1) the relation between level curves and horizontal traces. The level curves f(x, y) =k are just the traces of the graph off in the horizontal plane z k projected down to the xy-plane. Demonstration a = -1; b = 1; h = 0.1; [x, y] = meshgrid(a:h:b); z = 9-x.^2-2*y.^2 subplot (2,1,1); surf(x,y,z); title("Surface Plot"); subplot (2,2,2); mesh (x,y,z); title("Mesh Plot"); subplot (2,2,3); contour3(x, y, z); title("Level Curves"); grid on subplot (2,2,4); contour(x,y,z); title("Contour Plot"); axis equal grid on %Enter the lower limit of both x and y in the domain of the sketch %Enter the upper limit of both x and y in the domain of the sketch %Identify the limit %Create the domain of the graph %Encode the function in terms of x and y (Note that all operations between x's and y's are done with dotted operationF1 %Plot the given surface %Set the title as "Surface Plot" %Use the second plotting space %Mesh Plot the given surface % Set the title as "Mesh Plot" %Use the third plotting space %Plot the Level Curves of the given surface % Set the title as "Level Curves" %Use the fourth plotting space %Plot the Level Curvesof the given surface %Set the title as "Contour Plot" %Set the x axis and y axis to have the same scale My Solutions > % Start Using Rotate 3D Tools to rotate the solids Exercise: Perform the Surface, Mesh, Level Curves and Contour Plot of the surface over the indicated domain z = xye-²-², -2<x<2 and -2<y<2 at h=0.2 Exercise: Perform the Surface, Mesh, Level Curves and Contour Plot of the surface over the indicated domain z = xye-²-², -2<x<2 and -2<y<2 at h=0.2 Script %Set the Domain of both x and y by setting the lower limit 2 a = 3 b = 4 h = 5 6 %Setup the graphing properties for both x and y and z. 7 8 9 10 %First Plotting Space. Sketch the surface with the title "Surface Plot" 11 12 13 %Enter the lower limit of both x and y in the domain of the sketch %Enter the upper limit of both x and y in the domain of the sketch %Identify the increment 28 28 29 14 15 %Second Plotting Space. Sketch the Mesh with the title "Mesh Plot" 16 17 18 19 20 21 %Third Plotting Space. Sketch the Level Curves at various heights with the title "Level Curves" %Use the third plotting space 22 30 31 %Divide the plotting space into Four parts and use the first plotting area %Plot the given surface % Set the title as "Surface Plot" %Create the domain of the graph %Encode the function in terms of x and y (Note that all operations between x's and y's are done with dotted operat 23 24 23 25 26 27 %Fourth Plotting Space. Sketch the Contour Map with the title "Contour Plot" %Use the fourth plotting space %Plot the Level Curvesof the given surface %Set the title as "Contour Plot" %First Plotting Space. Sketch the surface with the title "Surface Plot" %Use the second plotting space %Mesh Plot the given surface % Set the title as "Mesh Plot" %Plot the Level Curves of the given surface % Set the title as "Level Curves" % Set Grid On Save %Set Grid On %Set the Axes to have the same scale 32 33 34 % Start Using Rotate 3D Tools to rotate the solids C Reset MATLAB Documentation ▶ Run Script ?
Expert Answer:
Answer rating: 100% (QA)
It seems like youre asking for assistance with plotting the surface mesh level curves and contour pl... View the full answer

Related Book For 

Microeconomics An Intuitive Approach with Calculus
ISBN: 978-0538453257
1st edition
Authors: Thomas Nechyba
Posted Date:
Students also viewed these programming questions
-
Planning is one of the most important management functions in any business. A front office managers first step in planning should involve determine the departments goals. Planning also includes...
-
Read the case study "Southwest Airlines," found in Part 2 of your textbook. Review the "Guide to Case Analysis" found on pp. CA1 - CA11 of your textbook. (This guide follows the last case in the...
-
You have the following frequency distribution of the Travel Time to work for residents in South Beach neighborhood. Please answer the questions that follow after the Frequency Table. Travel Time a....
-
My Fair Lady Inc. sells ladies' fashions. The following balances were as at March 1, 2015: Accumulated other comprehensive income . . . . . . . . . . . . . . . $253,967 Retained earnings . . . . . ....
-
Find the general solution of the following equations. Express the solution explicitly as a function of the independent variable. y' (t)e/2 = y + 4
-
In the morning, a hiker at the bottom of a mountain heads up the trail toward the top. At the same instant, another hiker at the top of the mountain heads down the same trail toward the bottom. Each...
-
Kelly Company issues 12% bonds with a face value of $10,000 and 600 shares of $10 par common stock in a combined sale, receiving total proceeds of $23,000. Required Record the transaction for each...
-
How do you gauge the efficacy of strategic planning interventions in fostering organizational resilience and adaptability amidst dynamic market conditions and technological advancements?
-
You, CPA, work as an associate with Campbell and Associates LLP, a financial and business advisory firm. The board of directors of Pembroke Pulp and Paper Inc. (PPPI) has engaged your firm once again...
-
An aluminium plate surface coated with a brittle Al2O3 at 420C using sputter coating techniques to protect the surface from cyclic failure. Find out the fatigue life of the coated aluminium surface...
-
How can swaps be used to reduce risk? To lower borrowing costs?
-
What are the five major merger waves that have occurred in the United States?
-
Is the corporate cost of capital constant regardless of the amount of new capital required? Explain your answer.
-
Why a case study on Amazon? Surely everyone knows about Amazon and what it does? Yes, well, thats maybe true, but this case goes under the surface to review some of the insider secrets of Amazons...
-
Do mergers create value? If so, where does this value go?
-
The owner of a small snack food and potato chip manufacturer, California Crunch Company, has asked you to investigate a possible issue with the company's payroll. They have provided you with this...
-
Show, if u(x, y) and v(x, y) are harmonic functions, that u + v must be a harmonic function but that uv need not be a harmonic function. Is e"e" a harmonic function?
-
Sometimes we can infer something about tastes from observing only two choices under two different economic circumstances. A. Suppose we consume only beer and pizza (sold at prices p1 and p2...
-
Increased Liquidity, Procrastination and National Savings: Over the past few decades, increasingly sophisticated financial investment possibilities have enabled individuals to place their savings...
-
In exercise 23.3, we analyzed the case of a monopoly health insurance provider. We now extend the analysis to second-degree price discrimination, with x again denoting the degree of health insurance...
-
Distinguish between public international law and private international law.
-
What are Incoterms? Give examples.
-
What is meant by the proper law of the contract?

Study smarter with the SolutionInn App