

Question: library ( shiny ) library ( gtrendsR ) library ( ggplot 2 ) ui - fluidPage ( titlePanel ( Google Trends Data Visualization )
libraryshiny
librarygtrendsR
libraryggplot
ui fluidPage
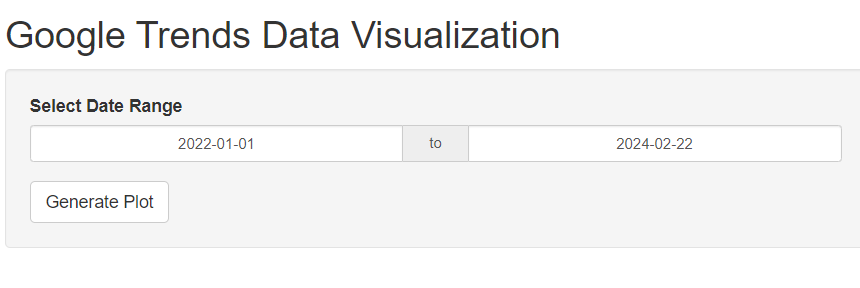
titlePanelGoogle Trends Data Visualization"
sidebarLayout
sidebarPanel
dateRangeInputdateRange "Select Date Range",
start
end formatSysDateYmd
actionButtonsubmit "Generate Plot"
mainPanel
plotOutputtrendPlot
server functioninput output
observeEventinput$submit,
reqinput$dateRange
startdate formatinput$dateRangeYmd
enddate formatinput$dateRangeYmd
Data gtrendskeyword cAPPLE 'META' geo US time pastestartdate, enddate
ggplotData aesx date, y hits, color keyword
geompoint
labstitle "Google Trends Data",
x "Date",
y "Search Volume"
shinyAppui ui server server
Google Trends Data Visualization
Select Date Range
Can you please help me with this code?
Step by Step Solution
There are 3 Steps involved in it
1 Expert Approved Answer
Step: 1 Unlock

Question Has Been Solved by an Expert!
Get step-by-step solutions from verified subject matter experts
Step: 2 Unlock
Step: 3 Unlock