

Question: library ( tidyverse ) #data manipulation & plotting library ( stringr ) # text cleaning and regular expressions library ( tidytext ) # provides additional
librarytidyverse #data manipulation & plotting
librarystringr # text cleaning and regular expressions
librarytidytext # provides additional text mining functions
LOTR readRDSLOTRRDS ## read in the text of
stopwords tidytext::stopwords
tokens LOTR unnesttokens word text
tokens tokens dplyr::filterword in stopwords $ word
allwordcounts tokens groupbybook chapter
count word sort TRUE ungroup
allwordcountsmat allwordcounts spread keyword, valuen fill
wordcounts allwordcountsmat ring
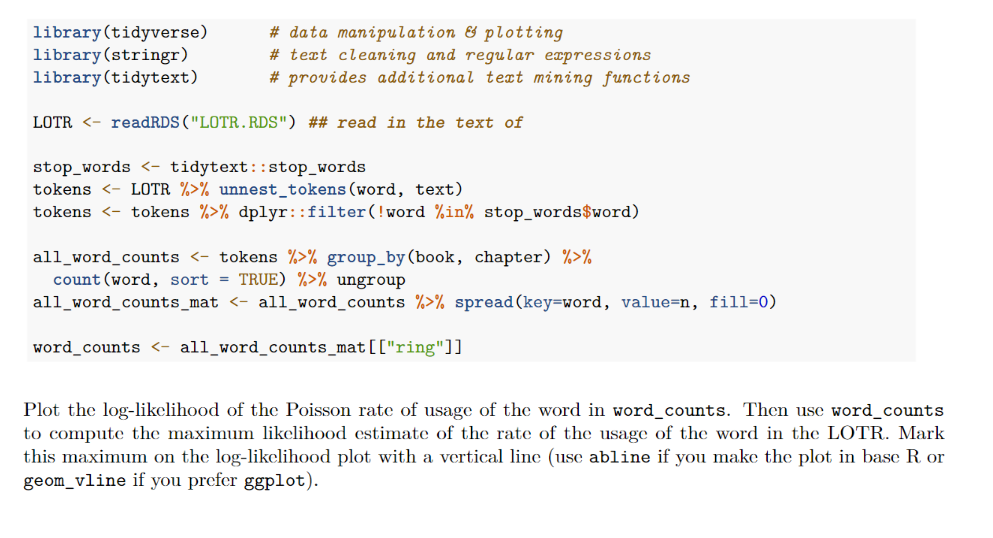
Plot the loglikelihood of the Poisson rate of usage of the word in wordcounts. Then use wordcounts
to compute the maximum likelihood estimate of the rate of the usage of the word in the LOTR. Mark
this maximum on the loglikelihood plot with a vertical line use abline if you make the plot in base or
geomvline if you prefer ggplot
Step by Step Solution
There are 3 Steps involved in it
1 Expert Approved Answer
Step: 1 Unlock

Question Has Been Solved by an Expert!
Get step-by-step solutions from verified subject matter experts
Step: 2 Unlock
Step: 3 Unlock