

Question: Licensed Drivers Activity ( 4 0 pts ) Download the LicensedDriversAllStates 1 9 9 6 - 2 0 1 8 dataset. This dataset includes
Licensed Drivers Activity pts
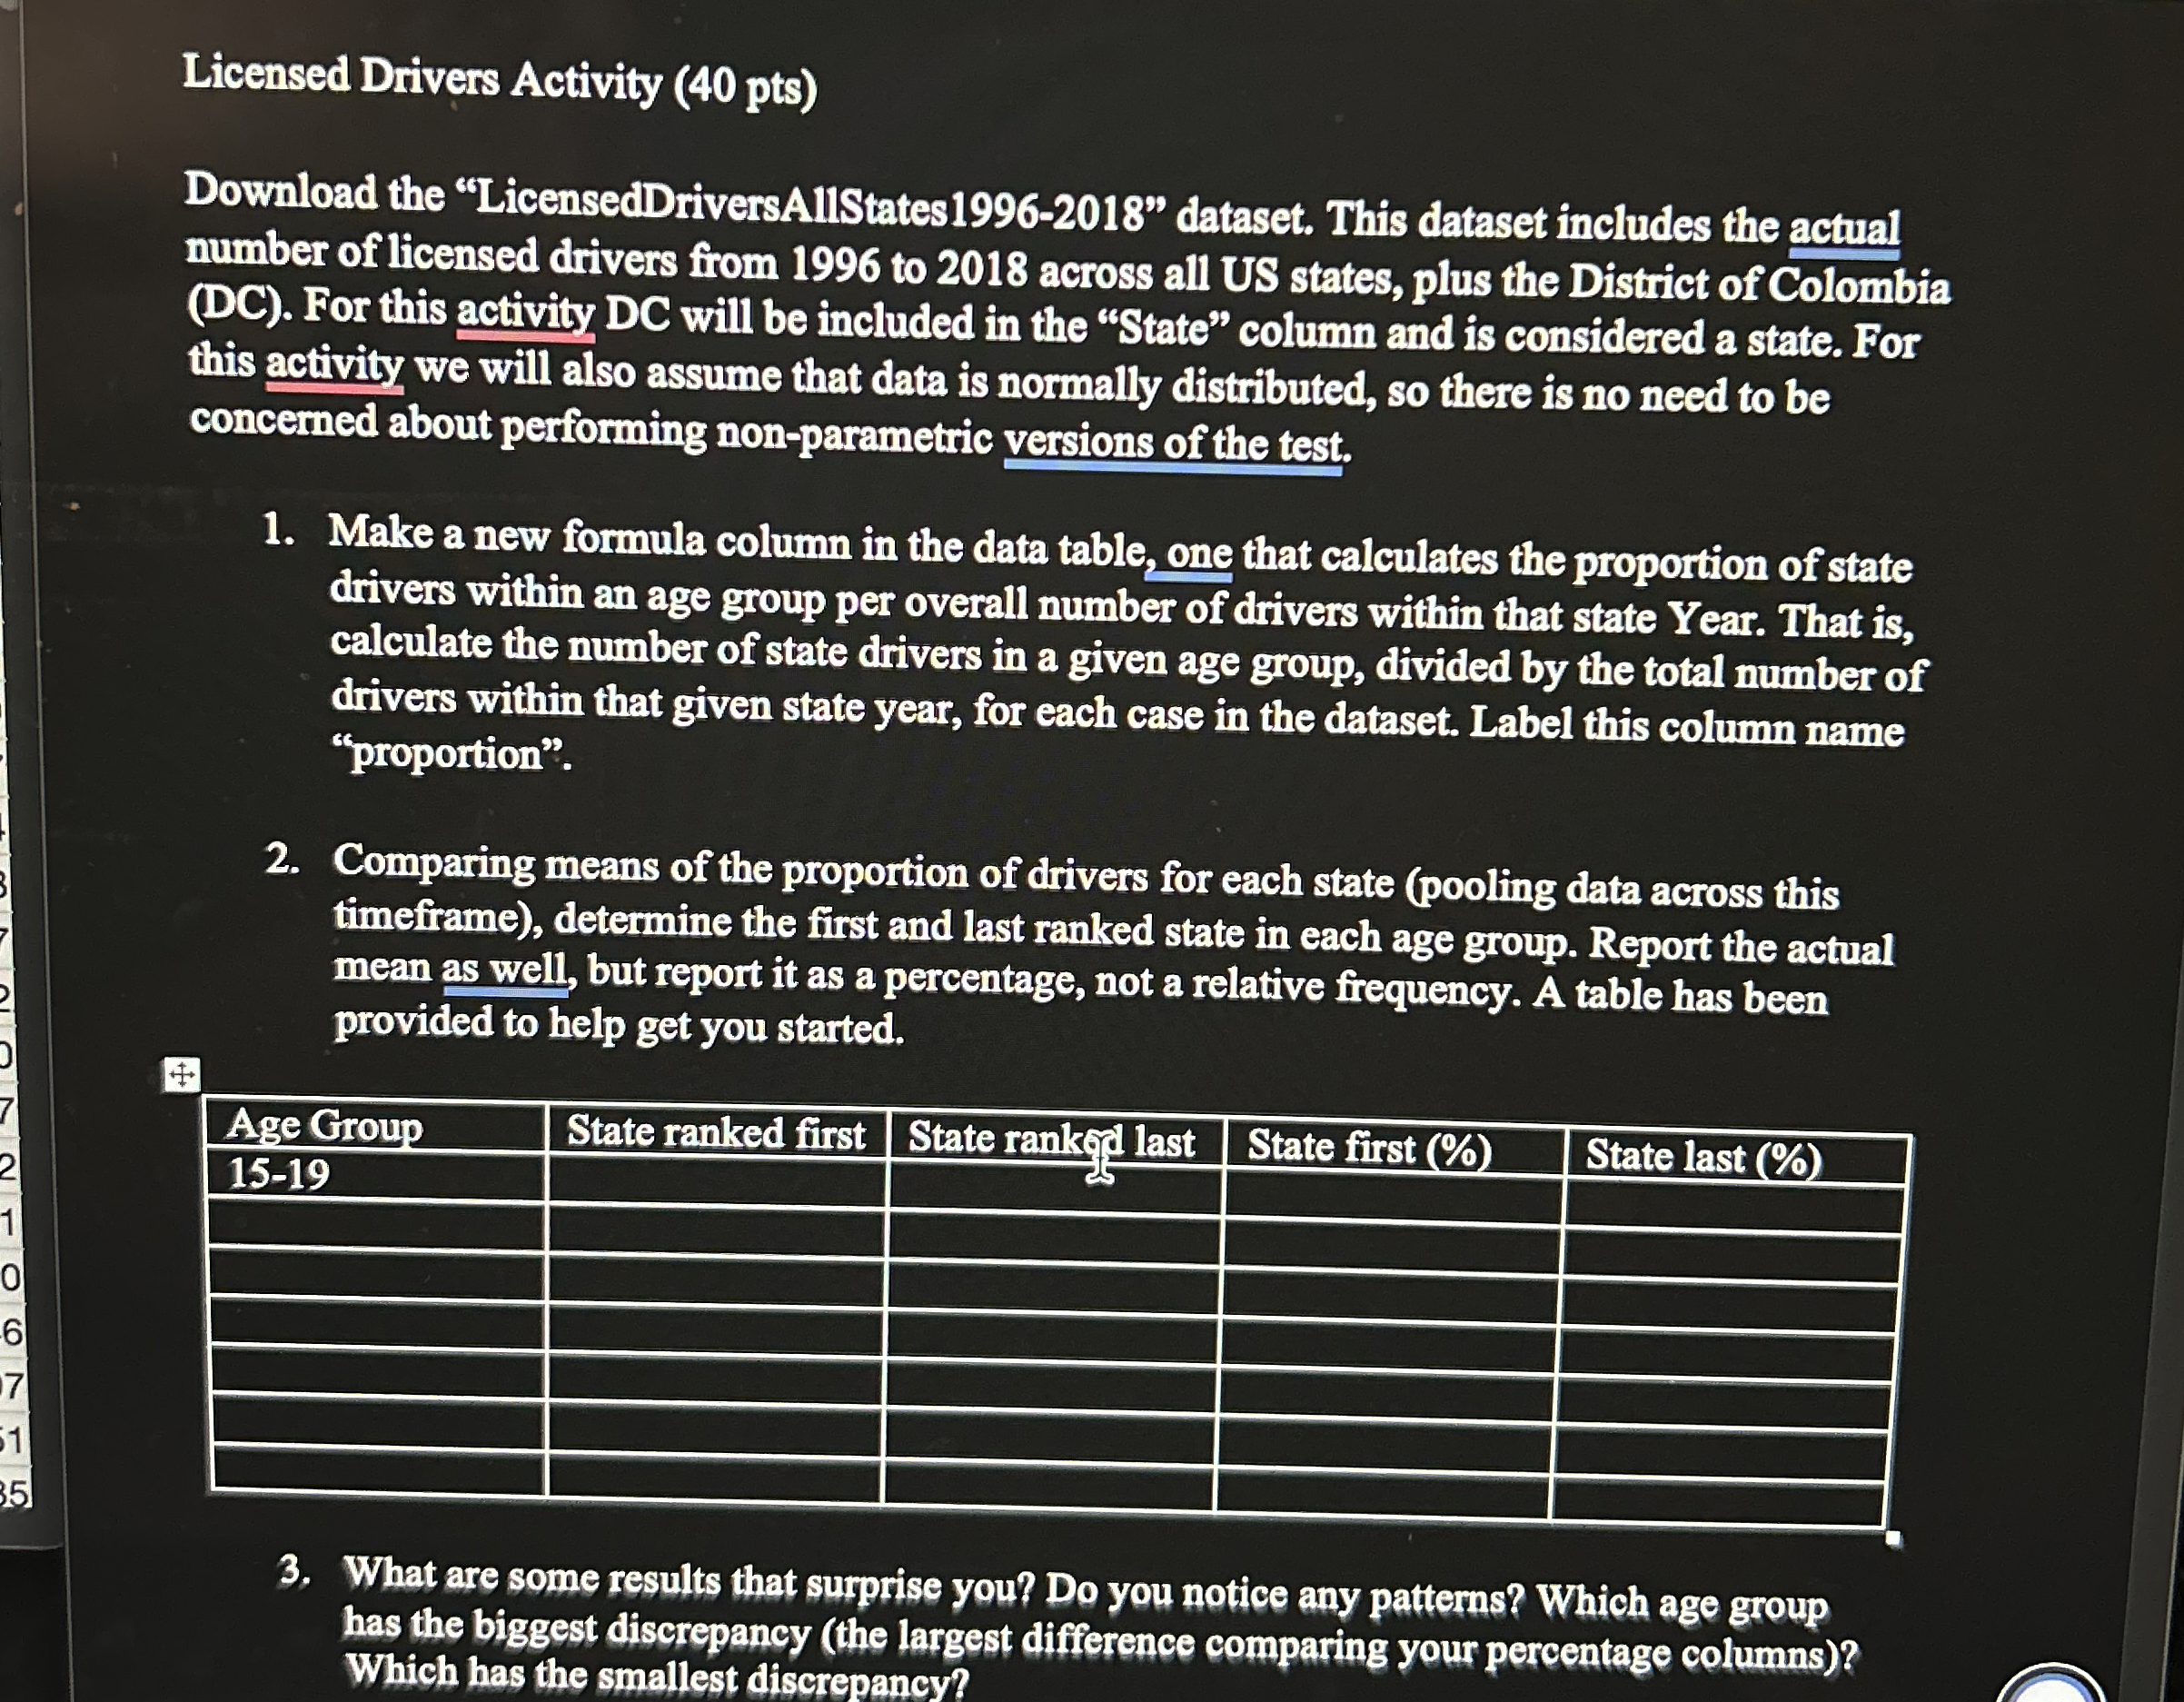
Download the "LicensedDriversAllStates dataset. This dataset includes the actual number of licensed drivers from to across all US states, plus the District of Colombia DC For this activity DC will be included in the "State" column and is considered a state. For this activity we will also assume that data is normally distributed, so there is no need to be concerned about performing nonparametric versions of the test.
Make a new formula column in the data table, one that calculates the proportion of state drivers within an age group per overall number of drivers within that state Year. That is calculate the number of state drivers in a given age group, divided by the total number of drivers within that given state year, for each case in the dataset. Label this column name "proportion".
Comparing means of the proportion of drivers for each state pooling data across this timeframe determine the first and last ranked state in each age group. Report the actual mean as well, but report it as a percentage, not a relative frequency. A table has been provided to help get you started.
tableAge Group,State ranked first,State rankg! last,State first State last
What are some results that surprise you? Do you notice any patterns? Which age group has the biggest discrepancy the largest difference comparing your percentage columns Which has the smallest discrepancy?
Step by Step Solution
There are 3 Steps involved in it
1 Expert Approved Answer
Step: 1 Unlock

Question Has Been Solved by an Expert!
Get step-by-step solutions from verified subject matter experts
Step: 2 Unlock
Step: 3 Unlock