

Question: Line 18.6 1 2 3 4 5 6 7 8 9 10 2018 2019 2020 Q1 Q2 Q3 04 Q1 Q2 Q3 Q4 Q1 Q2
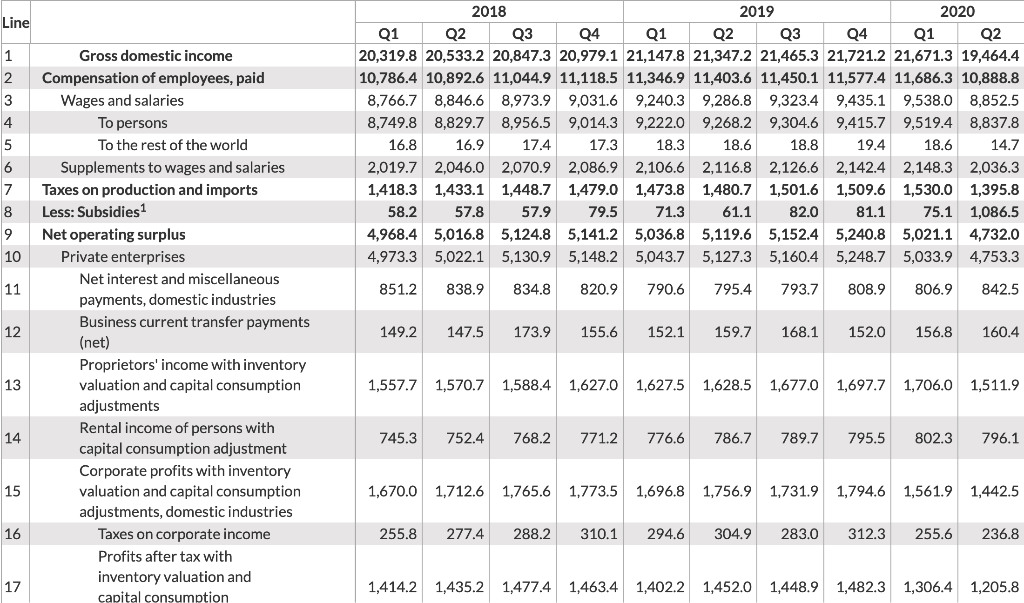
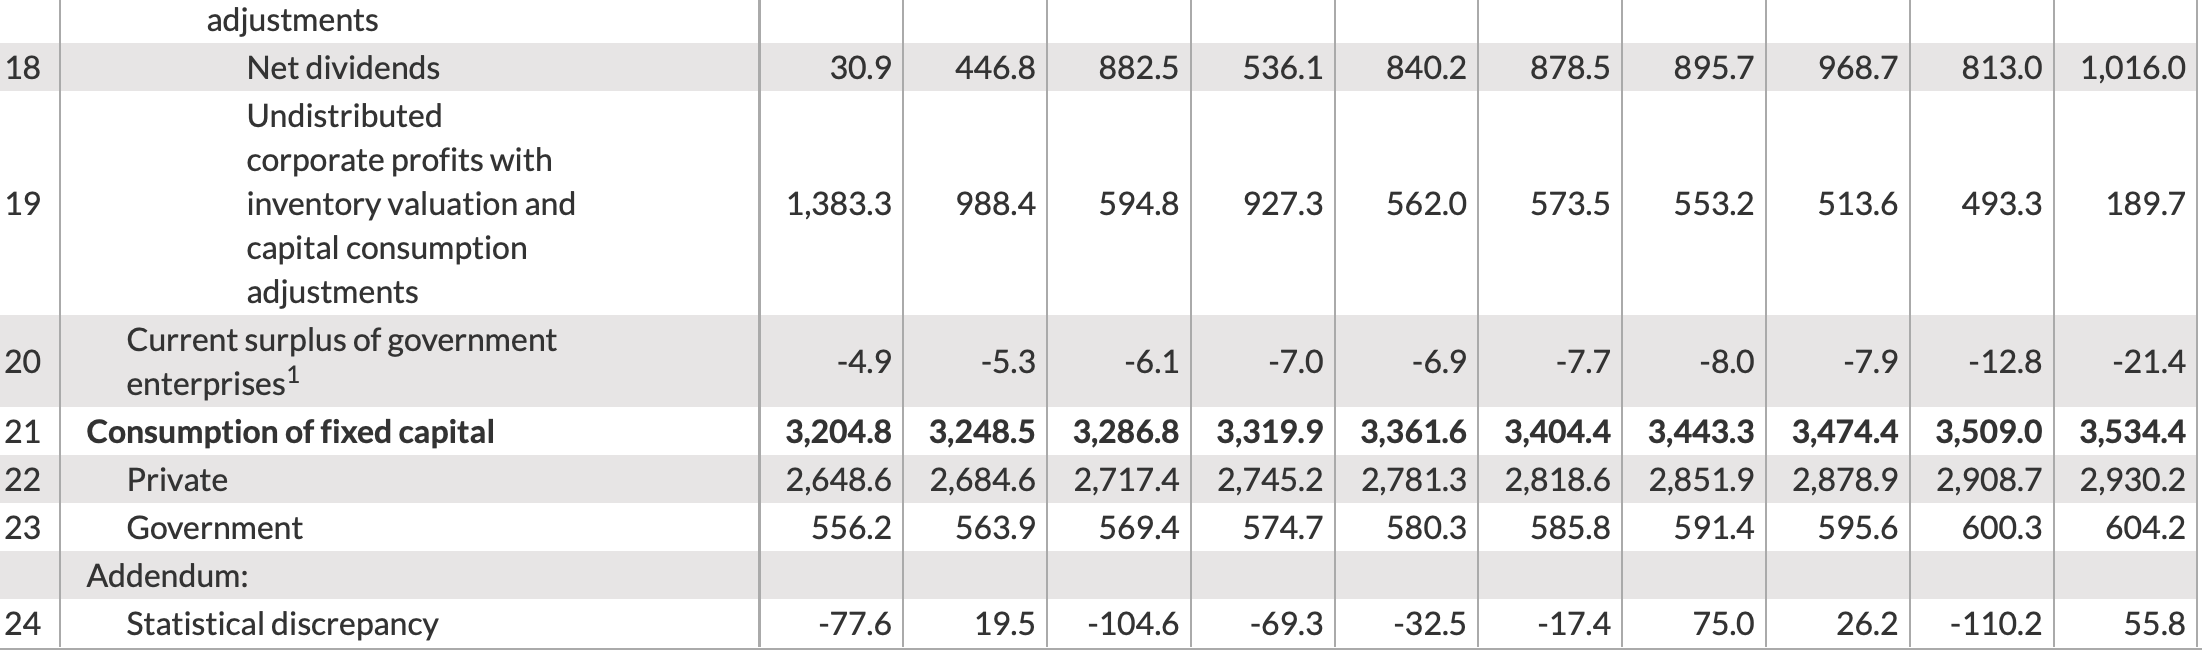
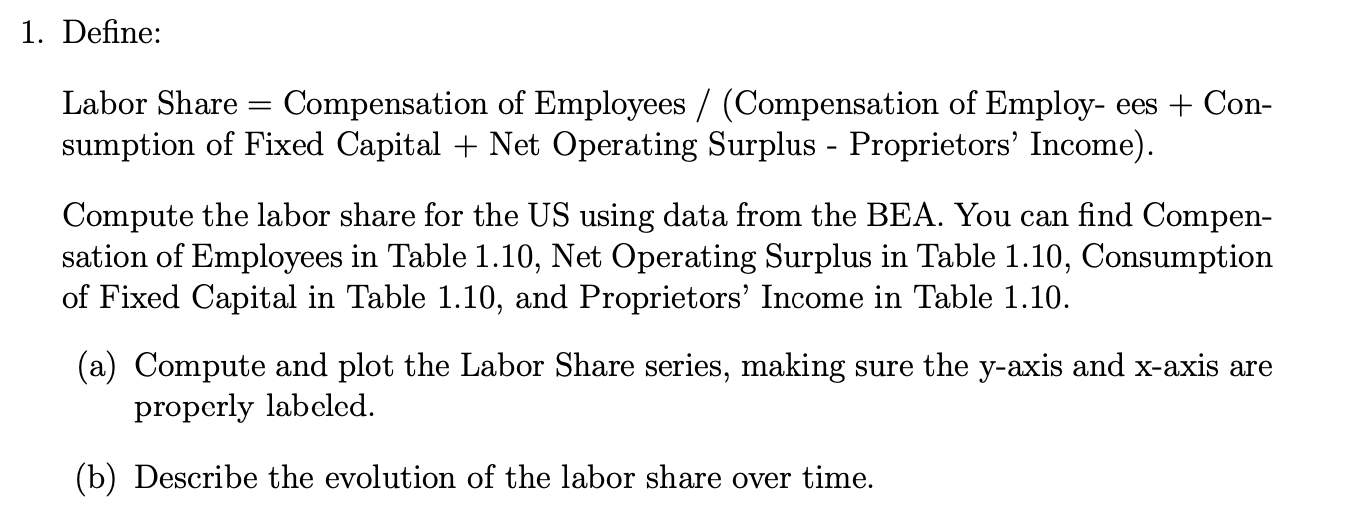
Line 18.6 1 2 3 4 5 6 7 8 9 10 2018 2019 2020 Q1 Q2 Q3 04 Q1 Q2 Q3 Q4 Q1 Q2 20,319.8 20,533.2 20,847.3 20,979.1 21,147.8 21,347.2 21,465.3 21,721.2 21,671.3 19,464.4 10,786.4 10,892.6 11,044.9 11,118.5 11,346.9 11,403.6 11,450.1 11,577.4 11,686.3 10,888.8 8,766.7 8,846.6 8,973.9 9,031.6 9,240.3 9,286.8 9,323.4 9,435.1 9,538.0 8,852.5 8,749.8 8,829.7 8,956.5 9,014.3 9,222.0 9,268.2 9,304.6 9,415.7 9,519.4 8,837.8 16.8 16.9 17.4 17.3 18.3 18.6 18.8 19.4 14.7 2,019.7 2,046.0 2,070.9 2,086.9 2,106.6 2,116.8 2,126.6 2,142.4 2,148.3 2,036.3 1,418.3 1,433.1 1,448.7 1,479.0 1,473.8 1,480.7 1,501.6 1,509.6 1,530.0 1,395.8 58.2 57.8 57.9 79.5 71.3 61.1 82.0 81.1 75.1 1,086.5 4,968.4 5,016.8 5,124.8 5,141.2 5,036.8 5,119.6 5,152.4 5,240.8 5,021.1 4,732.0 4,973.3 5,022.1 5,130.9 5,148.2 5,043.7 5,127.3 5,160.4 5,248.7 5,033.9 4,753.3 851.2 838.9 834.8 820.9 790.6 795.4 793.7 808.9 806.9 842.5 11 12 Gross domestic income Compensation of employees, paid Wages and salaries To persons To the rest of the world Supplements to wages and salaries Taxes on production and imports Less: Subsidies 1 Net operating surplus Private enterprises Net interest and miscellaneous payments, domestic industries Business current transfer payments (net) Proprietors' income with inventory valuation and capital consumption adjustments Rental income of persons with capital consumption adjustment Corporate profits with inventory valuation and capital consumption adjustments, domestic industries Taxes on corporate income Profits after tax with inventory valuation and capital consumption 149.2 147.5 173.9 155.6 152.1 159.7 168.1 152.0 156.8 160.4 13 1,557.7 1,570.7 1,588.4 1,627.0 1,627.5 1,628.5 1,677.0 1,697.7 1,706.0 1,511.9 14 745.3 752.4 768.2 771.2 776.6 786.7 789.7 795.5 802.3 796.1 15 1,670.0 1,712.6 1,765.6 1,773.5 1,696.8 1,756.9 1,731.9 1,794.6 1,561.9 1,442.5 16 255.8 277.4 288.2 310.1 294.6 304.9 283.0 312.3 255.6 236.8 17 1,414.2 1,435.2 1,477.4 1,463.4 1,402.2 1,452.0 1,448.9 1,482.3 1,306.4 1,205.8 18 30.9 446.8 882.5 536.1 840.2 878.5 895.7 968.7 813.0 1,016.0 19 1,383.3 988.4 594.8 927.3 562.0 573.5 553.2 513.6 493.3 189.7 adjustments Net dividends Undistributed corporate profits with inventory valuation and capital consumption adjustments Current surplus of government enterprises Consumption of fixed capital Private Government Addendum: Statistical discrepancy 20 -4.9 -5.3 -6.1 -7.0 -6.9 -7.7 -8.0 -7.9 -12.8 -21.4 21 22 23 3,204.8 3,248.5 3,286.8 3,319.9 3,361.6 3,404.4 3,443.3 3,474.4 3,509.0 3,534.4 2,648.6 2,684.6 2,717,4 2,745.2 2,781.3 2,818.6 2,851.9 2,878.9 2,908.7 2,930.2 556.2 563.9 569.4 574.7 580.3 585.8 591.4 595.6 600.3 604.2 24 -77.6 19.5 -104.6 -69.3 -32.5 -17.4 75.0 26.2 -110.2 55.8 1. Define: Labor Share = Compensation of Employees / (Compensation of Employ- ees + Con- sumption of Fixed Capital + Net Operating Surplus - Proprietors' Income). Compute the labor share for the US using data from the BEA. You can find Compen- sation of Employees in Table 1.10, Net Operating Surplus in Table 1.10, Consumption of Fixed Capital in Table 1.10, and Proprietors' Income in Table 1.10. (a) Compute and plot the Labor Share series, making sure the y-axis and x-axis are properly labeled (b) Describe the evolution of the labor share over time. Line 18.6 1 2 3 4 5 6 7 8 9 10 2018 2019 2020 Q1 Q2 Q3 04 Q1 Q2 Q3 Q4 Q1 Q2 20,319.8 20,533.2 20,847.3 20,979.1 21,147.8 21,347.2 21,465.3 21,721.2 21,671.3 19,464.4 10,786.4 10,892.6 11,044.9 11,118.5 11,346.9 11,403.6 11,450.1 11,577.4 11,686.3 10,888.8 8,766.7 8,846.6 8,973.9 9,031.6 9,240.3 9,286.8 9,323.4 9,435.1 9,538.0 8,852.5 8,749.8 8,829.7 8,956.5 9,014.3 9,222.0 9,268.2 9,304.6 9,415.7 9,519.4 8,837.8 16.8 16.9 17.4 17.3 18.3 18.6 18.8 19.4 14.7 2,019.7 2,046.0 2,070.9 2,086.9 2,106.6 2,116.8 2,126.6 2,142.4 2,148.3 2,036.3 1,418.3 1,433.1 1,448.7 1,479.0 1,473.8 1,480.7 1,501.6 1,509.6 1,530.0 1,395.8 58.2 57.8 57.9 79.5 71.3 61.1 82.0 81.1 75.1 1,086.5 4,968.4 5,016.8 5,124.8 5,141.2 5,036.8 5,119.6 5,152.4 5,240.8 5,021.1 4,732.0 4,973.3 5,022.1 5,130.9 5,148.2 5,043.7 5,127.3 5,160.4 5,248.7 5,033.9 4,753.3 851.2 838.9 834.8 820.9 790.6 795.4 793.7 808.9 806.9 842.5 11 12 Gross domestic income Compensation of employees, paid Wages and salaries To persons To the rest of the world Supplements to wages and salaries Taxes on production and imports Less: Subsidies 1 Net operating surplus Private enterprises Net interest and miscellaneous payments, domestic industries Business current transfer payments (net) Proprietors' income with inventory valuation and capital consumption adjustments Rental income of persons with capital consumption adjustment Corporate profits with inventory valuation and capital consumption adjustments, domestic industries Taxes on corporate income Profits after tax with inventory valuation and capital consumption 149.2 147.5 173.9 155.6 152.1 159.7 168.1 152.0 156.8 160.4 13 1,557.7 1,570.7 1,588.4 1,627.0 1,627.5 1,628.5 1,677.0 1,697.7 1,706.0 1,511.9 14 745.3 752.4 768.2 771.2 776.6 786.7 789.7 795.5 802.3 796.1 15 1,670.0 1,712.6 1,765.6 1,773.5 1,696.8 1,756.9 1,731.9 1,794.6 1,561.9 1,442.5 16 255.8 277.4 288.2 310.1 294.6 304.9 283.0 312.3 255.6 236.8 17 1,414.2 1,435.2 1,477.4 1,463.4 1,402.2 1,452.0 1,448.9 1,482.3 1,306.4 1,205.8 18 30.9 446.8 882.5 536.1 840.2 878.5 895.7 968.7 813.0 1,016.0 19 1,383.3 988.4 594.8 927.3 562.0 573.5 553.2 513.6 493.3 189.7 adjustments Net dividends Undistributed corporate profits with inventory valuation and capital consumption adjustments Current surplus of government enterprises Consumption of fixed capital Private Government Addendum: Statistical discrepancy 20 -4.9 -5.3 -6.1 -7.0 -6.9 -7.7 -8.0 -7.9 -12.8 -21.4 21 22 23 3,204.8 3,248.5 3,286.8 3,319.9 3,361.6 3,404.4 3,443.3 3,474.4 3,509.0 3,534.4 2,648.6 2,684.6 2,717,4 2,745.2 2,781.3 2,818.6 2,851.9 2,878.9 2,908.7 2,930.2 556.2 563.9 569.4 574.7 580.3 585.8 591.4 595.6 600.3 604.2 24 -77.6 19.5 -104.6 -69.3 -32.5 -17.4 75.0 26.2 -110.2 55.8 1. Define: Labor Share = Compensation of Employees / (Compensation of Employ- ees + Con- sumption of Fixed Capital + Net Operating Surplus - Proprietors' Income). Compute the labor share for the US using data from the BEA. You can find Compen- sation of Employees in Table 1.10, Net Operating Surplus in Table 1.10, Consumption of Fixed Capital in Table 1.10, and Proprietors' Income in Table 1.10. (a) Compute and plot the Labor Share series, making sure the y-axis and x-axis are properly labeled (b) Describe the evolution of the labor share over time
Step by Step Solution
There are 3 Steps involved in it

Get step-by-step solutions from verified subject matter experts