

Question: line equation is y=.848X+.059 TU NAVN samples. 5. Use Microsoft Excel to graph absorbance versus concentration, using the equation of the line to find the
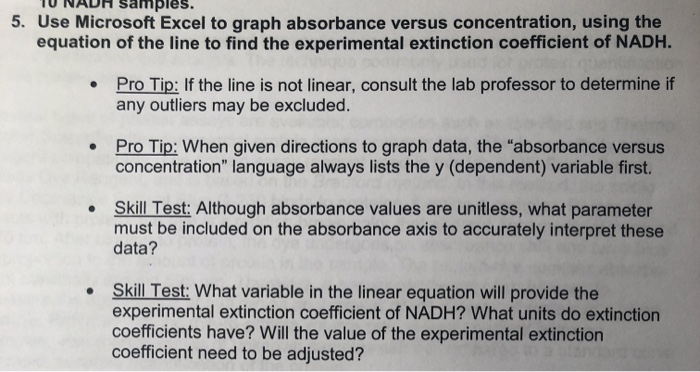
TU NAVN samples. 5. Use Microsoft Excel to graph absorbance versus concentration, using the equation of the line to find the experimental extinction coefficient of NADH. Pro Tip: If the line is not linear, consult the lab professor to determine if any outliers may be excluded. Pro Tip: When given directions to graph data, the "absorbance versus concentration" language always lists the y (dependent) variable first. Skill Test: Although absorbance values are unitless, what parameter must be included on the absorbance axis to accurately interpret these data? Skill Test: What variable in the linear equation will provide the experimental extinction coefficient of NADH? What units do extinction coefficients have? Will the value of the experimental extinction coefficient need to be adjusted? TU NAVN samples. 5. Use Microsoft Excel to graph absorbance versus concentration, using the equation of the line to find the experimental extinction coefficient of NADH. Pro Tip: If the line is not linear, consult the lab professor to determine if any outliers may be excluded. Pro Tip: When given directions to graph data, the "absorbance versus concentration" language always lists the y (dependent) variable first. Skill Test: Although absorbance values are unitless, what parameter must be included on the absorbance axis to accurately interpret these data? Skill Test: What variable in the linear equation will provide the experimental extinction coefficient of NADH? What units do extinction coefficients have? Will the value of the experimental extinction coefficient need to be adjusted
Step by Step Solution
There are 3 Steps involved in it

Get step-by-step solutions from verified subject matter experts