

Question: Line Graph Analysis - Drill Rig Efficiency Comparison ( 1 5 Marks ) A second dataset provides the monthly efficiency percentages for two drill rigs,
Line Graph Analysis Drill Rig Efficiency Comparison Marks
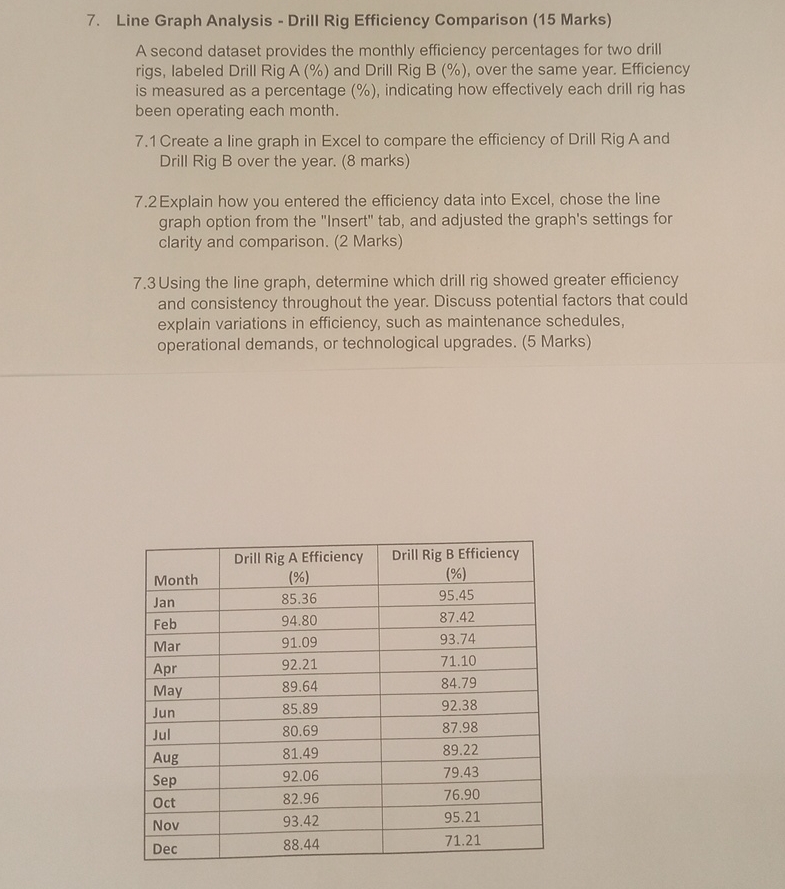
A second dataset provides the monthly efficiency percentages for two drill rigs, labeled Drill Rig A and Drill Rig B over the same year. Efficiency is measured as a percentage indicating how effectively each drill rig has been operating each month.
Create a line graph in Excel to compare the efficiency of Drill Rig A and Drill Rig B over the year. marks
Explain how you entered the efficiency data into Excel, chose the line graph option from the "Insert" tab, and adjusted the graph's settings for clarity and comparison. Marks
Using the line graph, determine which drill rig showed greater efficiency and consistency throughout the year. Discuss potential factors that could explain variations in efficiency, such as maintenance schedules, operational demands, or technological upgrades. Marks
tableMonthtableDrill Rig A Efficiency
Step by Step Solution
There are 3 Steps involved in it
1 Expert Approved Answer
Step: 1 Unlock

Question Has Been Solved by an Expert!
Get step-by-step solutions from verified subject matter experts
Step: 2 Unlock
Step: 3 Unlock