

Question: Line plot of temperature data 24 22 20 temperature 18 16 14 12 10 12 day Boxplot for comparison 30 25 temperature 20 H 15
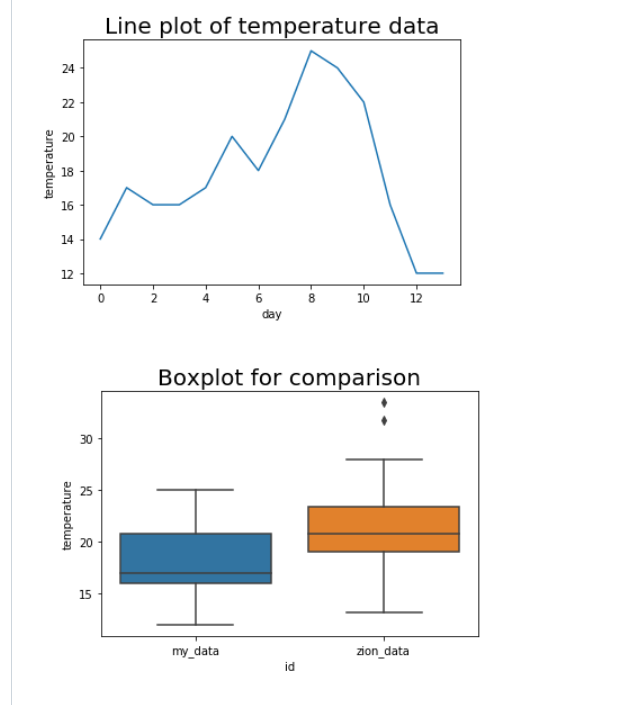

Line plot of temperature data 24 22 20 temperature 18 16 14 12 10 12 day Boxplot for comparison 30 25 temperature 20 H 15 my_data zion_data id
Step by Step Solution
There are 3 Steps involved in it
1 Expert Approved Answer
Step: 1 Unlock

Question Has Been Solved by an Expert!
Get step-by-step solutions from verified subject matter experts
Step: 2 Unlock
Step: 3 Unlock