

Question: (Linear Functions Fit to Data LC) A student believes there is a correlation between the number of texts sent during class and GPA. Identify
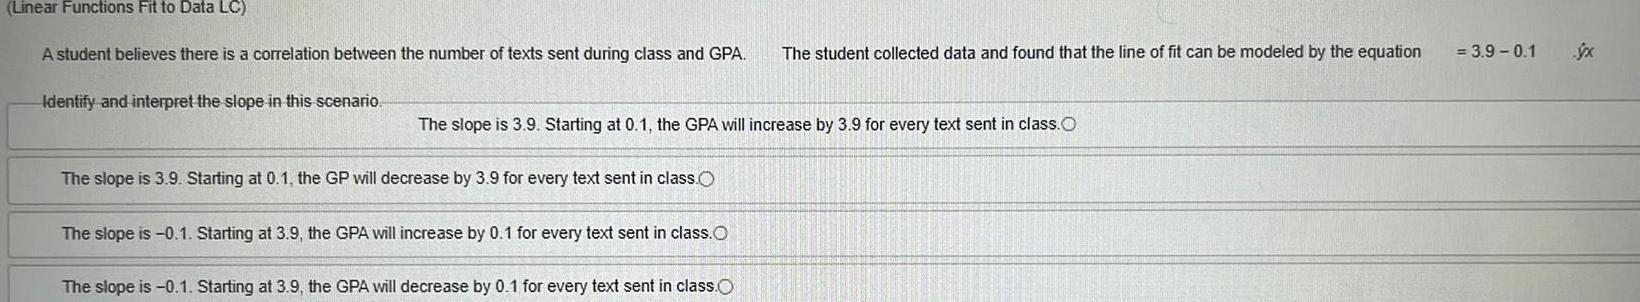
(Linear Functions Fit to Data LC) A student believes there is a correlation between the number of texts sent during class and GPA. Identify and interpret the slope in this scenario. The student collected data and found that the line of fit can be modeled by the equation The slope is 3.9. Starting at 0.1, the GPA will increase by 3.9 for every text sent in class. The slope is 3.9. Starting at 0.1, the GP will decrease by 3.9 for every text sent in class. The slope is -0.1. Starting at 3.9, the GPA will increase by 0.1 for every text sent in class. The slope is -0.1. Starting at 3.9, the GPA will decrease by 0.1 for every text sent in class. = 3.9-0.1 x
Step by Step Solution
There are 3 Steps involved in it

Get step-by-step solutions from verified subject matter experts