

Question: Linear Functions Fit to Data LC The scatter plot shows the number of households in millions that have cable television over eight consecutive years Number

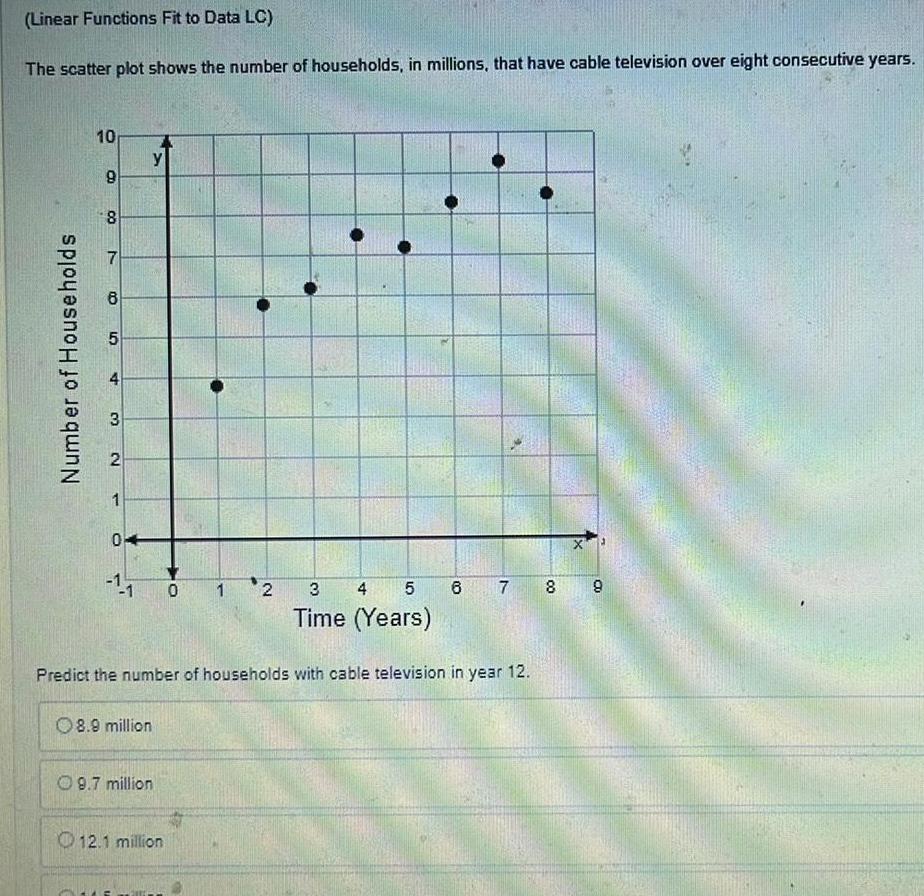
Linear Functions Fit to Data LC The scatter plot shows the number of households in millions that have cable television over eight consecutive years Number of Households 10 9 8 B 5 4 3 2 T 04 y 08 9 million 9 7 million 0 1 2 12 1 million Predict the number of households with cable television in year 12 3 5 Time Years 80x 4 6 7 8 9
Step by Step Solution
There are 3 Steps involved in it
1 Expert Approved Answer
Step: 1 Unlock

Question Has Been Solved by an Expert!
Get step-by-step solutions from verified subject matter experts
Step: 2 Unlock
Step: 3 Unlock