

Question: (Linear Functions Fit to Data MC) The graph shows a scatter plot for a set of data. Length (cm) 4 3.5 3 221 1.5
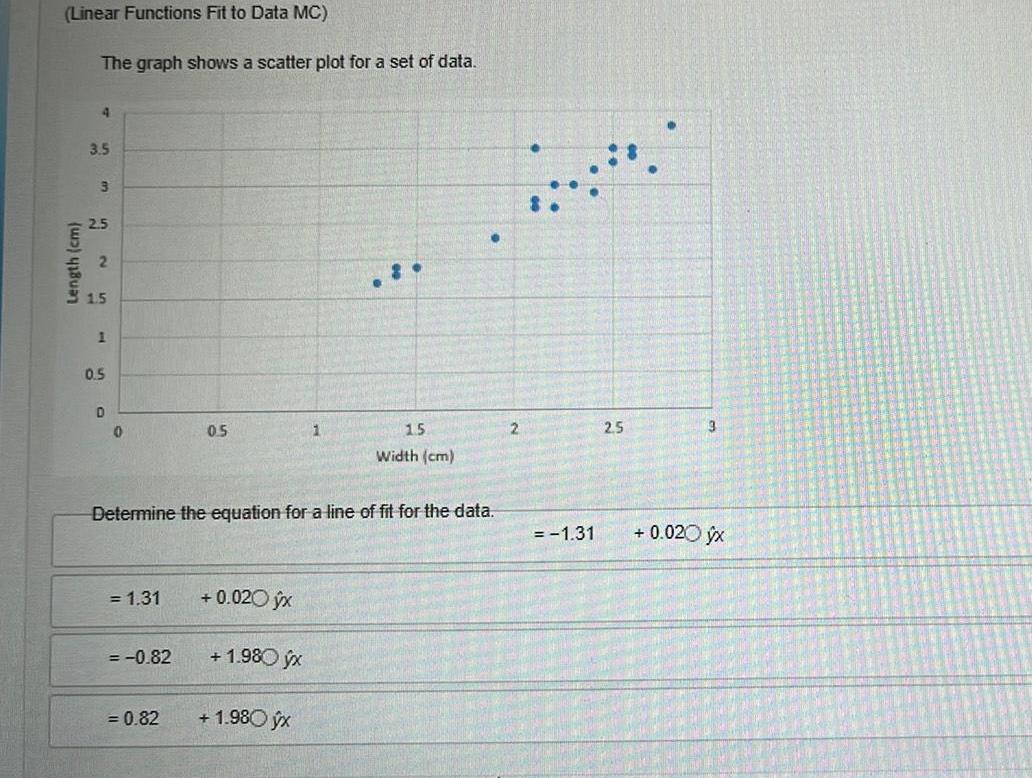
(Linear Functions Fit to Data MC) The graph shows a scatter plot for a set of data. Length (cm) 4 3.5 3 221 1.5 1 0.5 D 0 0.5 1 15 Width (cm) 2 2.5 3 Determine the equation for a line of fit for the data. = 1.31 +0.020 x = -0.82 +1.980 x = 0.82 +1.980 x =-1.31 + 0.020 x
Step by Step Solution
There are 3 Steps involved in it
1 Expert Approved Answer
Step: 1 Unlock

Question Has Been Solved by an Expert!
Get step-by-step solutions from verified subject matter experts
Step: 2 Unlock
Step: 3 Unlock