Question: Linear Optimization Models CSUSM Power Generation supplies electrical power to residential customers in 8 different cities throughout the U.S. Its main power generation plants are
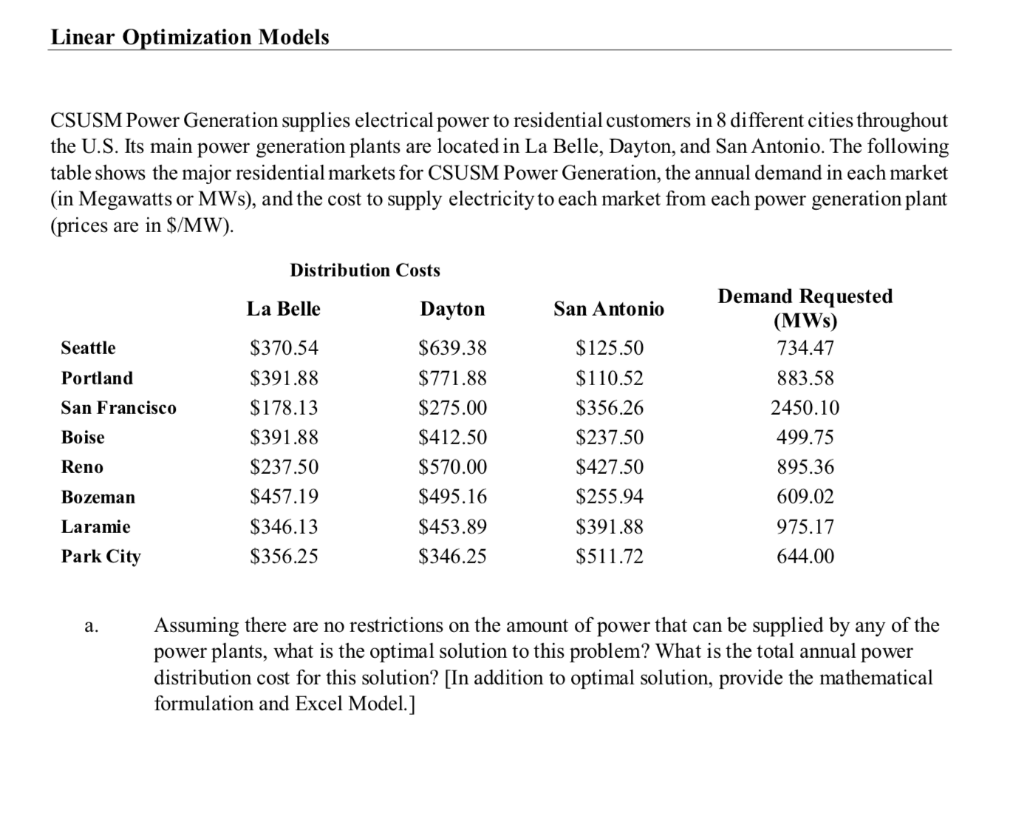
Linear Optimization Models CSUSM Power Generation supplies electrical power to residential customers in 8 different cities throughout the U.S. Its main power generation plants are located in La Belle, Dayton, and San Antonio. The following table shows the major residential markets for CSUSM Power Generation, the annual demand in each market (in Megawatts or MWs), and the cost to supply electricity to each market from each power generation plant (prices are in $/MW). Distribution Costs La Belle Dayton San Antonio Seattle Portland San Francisco Boise Reno Bozeman Laramie Park City $370.54 $391.88 $178.13 $391.88 $237.50 $457.19 $346.13 $356.25 $639.38 $771.88 $275.00 $412.50 $570.00 $495.16 $453.89 $346.25 $125.50 $110.52 $356.26 $237.50 $427.50 $255.94 $391.88 $511.72 Demand Requested (MWs) 734.47 883.58 2450.10 499.75 895.36 609.02 975.17 644.00 Assuming there are no restrictions on the amount of power that can be supplied by any of the power plants, what is the optimal solution to this problem? What is the total annual power distribution cost for this solution? [In addition to optimal solution, provide the mathematical formulation and Excel Model.] b. In reality, however, there are some restrictions on the supply as follows. Each power plant has a maximum capacity of 3,800 MWs of power to be supplied, The company requires that the supply for the power plant in San Antonio to be at least 20% of the total supply by CSUSM power plants, Given these realistic constraints, what is the optimal solution? What is the annual increase in power distribution cost that results from adding these constraints to the original formulation? In part b, if the power demand for Boise increases by 200 MWs, how much the optimal total cost will increase? Assuming that the total demand requested by cities can increase, which city's extra demand will be more costly to be satisfied? Use shadow prices from sensitivity report to answer this question. Linear Optimization Models CSUSM Power Generation supplies electrical power to residential customers in 8 different cities throughout the U.S. Its main power generation plants are located in La Belle, Dayton, and San Antonio. The following table shows the major residential markets for CSUSM Power Generation, the annual demand in each market (in Megawatts or MWs), and the cost to supply electricity to each market from each power generation plant (prices are in $/MW). Distribution Costs La Belle Dayton San Antonio Seattle Portland San Francisco Boise Reno Bozeman Laramie Park City $370.54 $391.88 $178.13 $391.88 $237.50 $457.19 $346.13 $356.25 $639.38 $771.88 $275.00 $412.50 $570.00 $495.16 $453.89 $346.25 $125.50 $110.52 $356.26 $237.50 $427.50 $255.94 $391.88 $511.72 Demand Requested (MWs) 734.47 883.58 2450.10 499.75 895.36 609.02 975.17 644.00 Assuming there are no restrictions on the amount of power that can be supplied by any of the power plants, what is the optimal solution to this problem? What is the total annual power distribution cost for this solution? [In addition to optimal solution, provide the mathematical formulation and Excel Model.] b. In reality, however, there are some restrictions on the supply as follows. Each power plant has a maximum capacity of 3,800 MWs of power to be supplied, The company requires that the supply for the power plant in San Antonio to be at least 20% of the total supply by CSUSM power plants, Given these realistic constraints, what is the optimal solution? What is the annual increase in power distribution cost that results from adding these constraints to the original formulation? In part b, if the power demand for Boise increases by 200 MWs, how much the optimal total cost will increase? Assuming that the total demand requested by cities can increase, which city's extra demand will be more costly to be satisfied? Use shadow prices from sensitivity report to answer this


