

Question: Linear regression analysis * Consider the auto dataset below. Then, I want to build a simple linear regression predicting mpg as a Y variable. (SAS
Linear regression analysis * Consider the auto dataset below. Then, I want to build a simple linear regression predicting mpg as a Y variable. (SAS code, please)
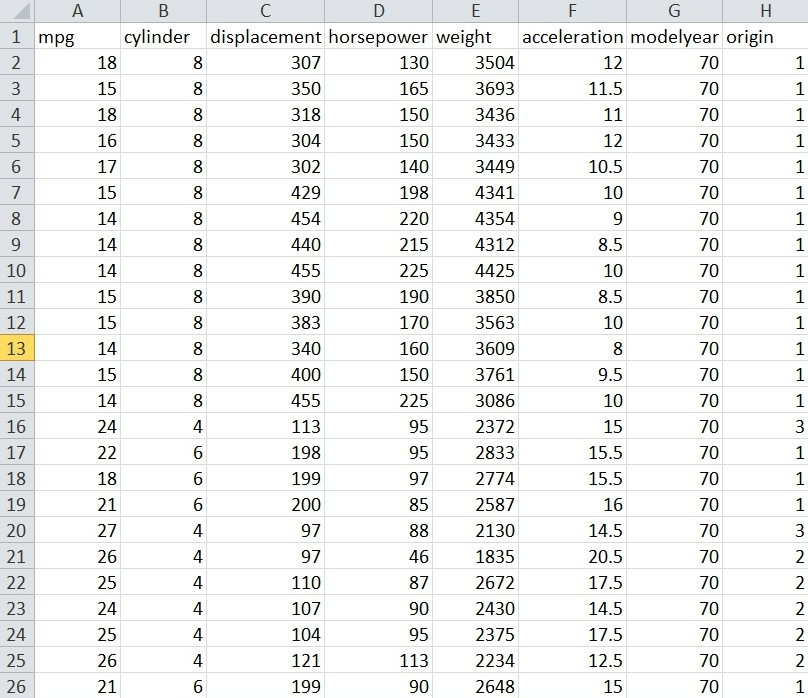
(auto dataset)
(reference for d,e,f) - ONLY solve in part (d), (e), (f), please.
Assume that you choose weight variable as a x variable. For auto.csv file, you can google it. I can't upload the cover file here. Sorry about that.
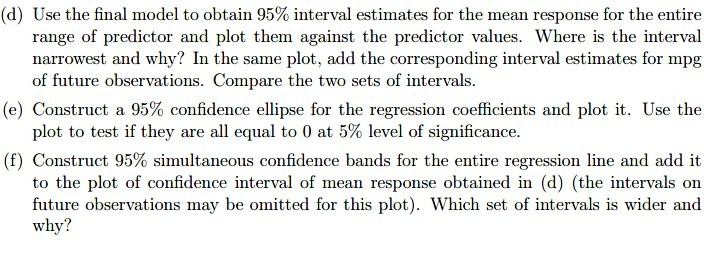
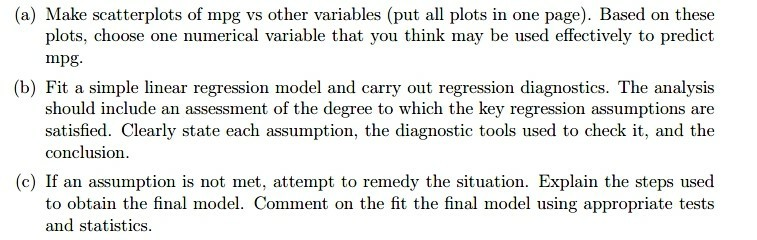
(d) Use the final model to obtain 95% interval estimates for the mean response for the entire range of predictor and plot them against the predictor values. Where is the interval narrowest and why? In the same plot, add the corresponding interval estimates for mpg of future observations. Compare the two sets of intervals. (e) Construct a 95% confidence ellipse for the regression coefficients and plot it. Use the plot to test if they are all equal to 0 at 5% level of significance. (f) Construct 95% simultaneous confidence bands for the entire regression line and add it to the plot of confidence interval of mean response obtained in (d) (the intervals on future observations may be omitted for this plot). Which set of intervals is wider and why? 1 mpg 1 8 8 8 1 1 1 1 1 1 8 1 1 2 3 4 5 6 7 8 9 10 11 12 13 14 15 16 17 18 70 1 10 B C D E F G H cylinder displacement horsepower weight acceleration modelyear origin 18 8 307 130 3504 12 70 8 350 165 3693 11.5 70 18 8 318 150 3436 11 70 304 150 3433 12 70 17 8 302 140 3449 10.5 70 15 8 429 198 4341 10 70 14 8 454 220 4354 9 70 14 440 215 4312 8.5 70 14 8 455 225 4425 10 15 8 390 190 3850 8.5 70 15 8 383 170 3563 70 14 8 340 160 3609 8 70 15 8 400 150 3761 9.5 70 14 8 455 225 3086 10 70 24 4 113 95 2372 70 22 6 198 95 2833 15.5 18 6 199 97 2774 15.5 70 21 6 200 85 2587 16 70 27 4 97 88 2130 14.5 70 26 4 97 1835 20.5 70 25 4 110 87 2672 17.5 70 4 107 90 2430 14.5 70 25 4 104 95 2375 17.5 70 26 4 121 113 2234 12.5 70 21 6 199 90 2648 15 70 8 8 1 1 1 1 1 1 3 1 1 1 3 15 70 19 3 46 N 2 20 21 22 23 24 25 26 2 2 24 4 NN 1 (a) Make scatterplots of mpg vs other variables (put all plots in one page). Based on these plots, choose one numerical variable that you think may be used effectively to predict mpg. (b) Fit a simple linear regression model and carry out regression diagnostics. The analysis should include an assessment of the degree to which the key regression assumptions are satisfied. Clearly state each assumption, the diagnostic tools used to check it, and the conclusion. (c) If an assumption is not met, attempt to remedy the situation. Explain the steps used to obtain the final model. Comment on the fit the final model using appropriate tests and statistics. (d) Use the final model to obtain 95% interval estimates for the mean response for the entire range of predictor and plot them against the predictor values. Where is the interval narrowest and why? In the same plot, add the corresponding interval estimates for mpg of future observations. Compare the two sets of intervals. (e) Construct a 95% confidence ellipse for the regression coefficients and plot it. Use the plot to test if they are all equal to 0 at 5% level of significance. (f) Construct 95% simultaneous confidence bands for the entire regression line and add it to the plot of confidence interval of mean response obtained in (d) (the intervals on future observations may be omitted for this plot). Which set of intervals is wider and why? 1 mpg 1 8 8 8 1 1 1 1 1 1 8 1 1 2 3 4 5 6 7 8 9 10 11 12 13 14 15 16 17 18 70 1 10 B C D E F G H cylinder displacement horsepower weight acceleration modelyear origin 18 8 307 130 3504 12 70 8 350 165 3693 11.5 70 18 8 318 150 3436 11 70 304 150 3433 12 70 17 8 302 140 3449 10.5 70 15 8 429 198 4341 10 70 14 8 454 220 4354 9 70 14 440 215 4312 8.5 70 14 8 455 225 4425 10 15 8 390 190 3850 8.5 70 15 8 383 170 3563 70 14 8 340 160 3609 8 70 15 8 400 150 3761 9.5 70 14 8 455 225 3086 10 70 24 4 113 95 2372 70 22 6 198 95 2833 15.5 18 6 199 97 2774 15.5 70 21 6 200 85 2587 16 70 27 4 97 88 2130 14.5 70 26 4 97 1835 20.5 70 25 4 110 87 2672 17.5 70 4 107 90 2430 14.5 70 25 4 104 95 2375 17.5 70 26 4 121 113 2234 12.5 70 21 6 199 90 2648 15 70 8 8 1 1 1 1 1 1 3 1 1 1 3 15 70 19 3 46 N 2 20 21 22 23 24 25 26 2 2 24 4 NN 1 (a) Make scatterplots of mpg vs other variables (put all plots in one page). Based on these plots, choose one numerical variable that you think may be used effectively to predict mpg. (b) Fit a simple linear regression model and carry out regression diagnostics. The analysis should include an assessment of the degree to which the key regression assumptions are satisfied. Clearly state each assumption, the diagnostic tools used to check it, and the conclusion. (c) If an assumption is not met, attempt to remedy the situation. Explain the steps used to obtain the final model. Comment on the fit the final model using appropriate tests and statisticsStep by Step Solution
There are 3 Steps involved in it
1 Expert Approved Answer
Step: 1 Unlock

Question Has Been Solved by an Expert!
Get step-by-step solutions from verified subject matter experts
Step: 2 Unlock
Step: 3 Unlock