

Question: Linear Regression and Correlation Please help with answering 9.24 (a, b, c) 9.24. )For the house sales data in Table 9.4, Table 9.12 shows a
Linear Regression and Correlation Please help with answering 9.24 (a, b, c)
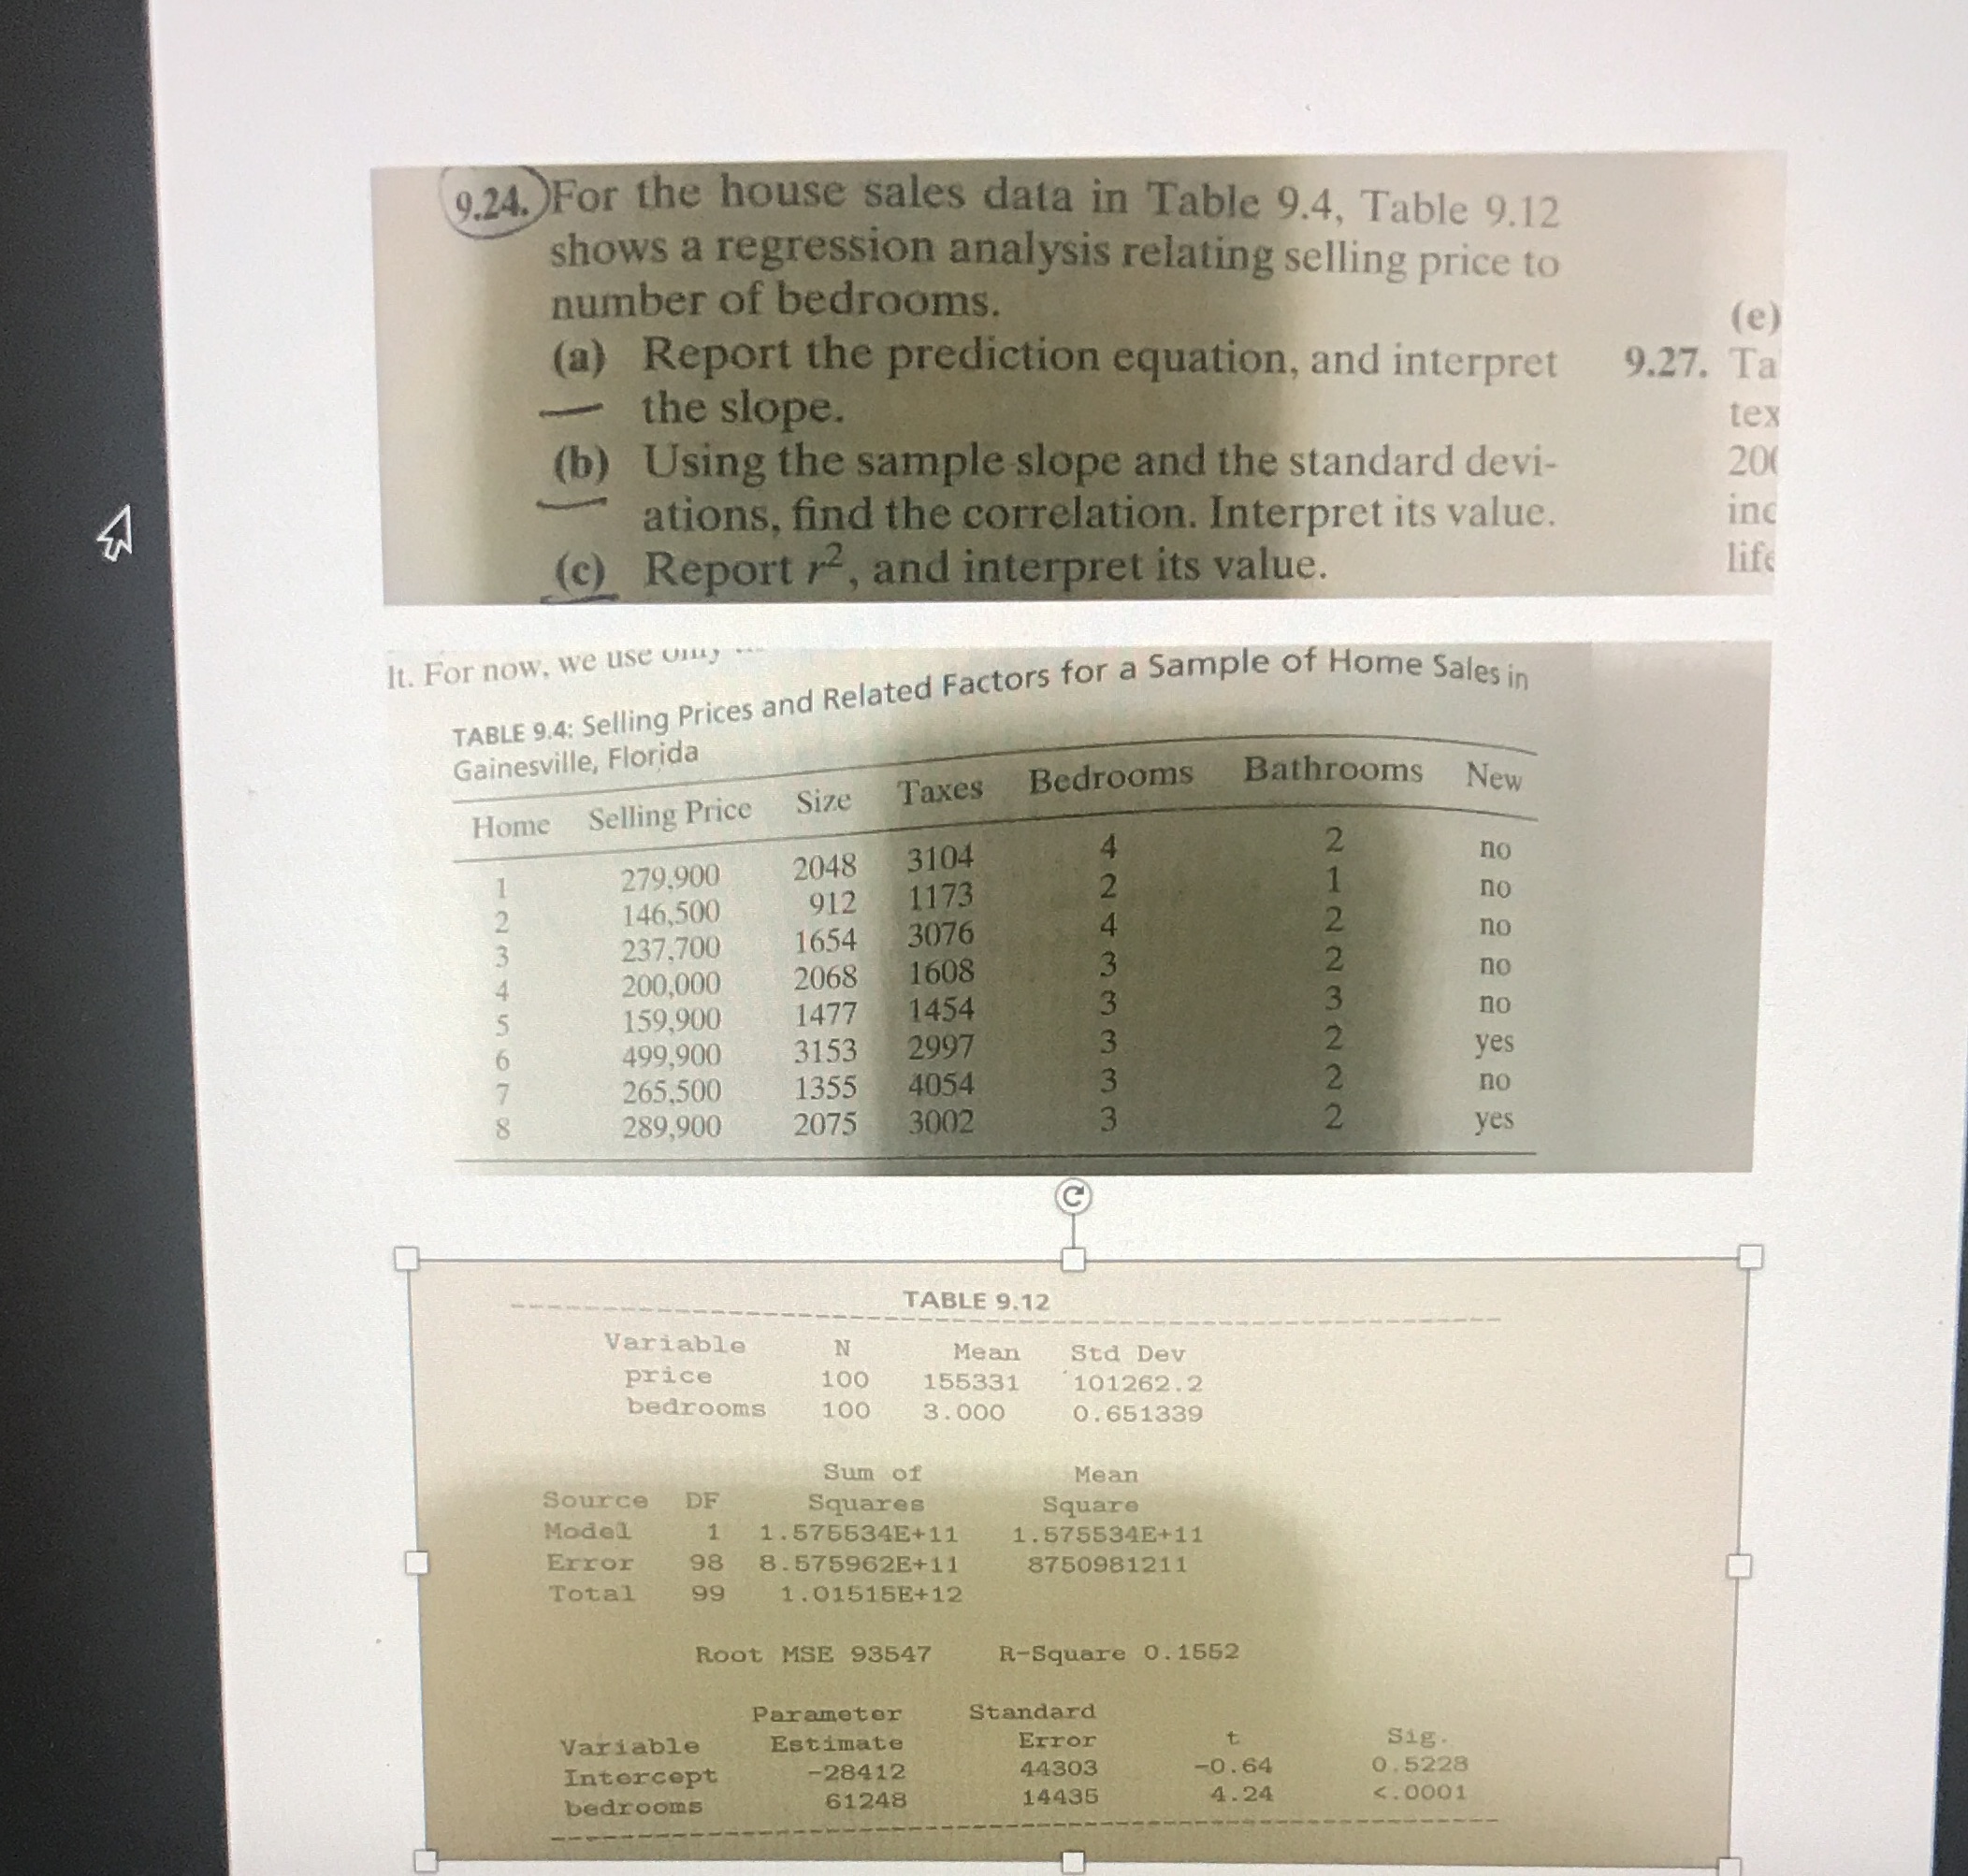
9.24. )For the house sales data in Table 9.4, Table 9.12 shows a regression analysis relating selling price to number of bedrooms. (e) (a) Report the prediction equation, and interpret 9.27. Ta the slope. tex (b) Using the sample slope and the standard devi- 201 ations, find the correlation. Interpret its value. inc (c) Report re, and interpret its value. life It. For now, we use my TABLE 9.4: Selling Prices and Related Factors for a Sample of Home Sales in Gainesville, Florida Home Selling Price Size Taxes Bedrooms Bathrooms New 2048 3104 no 279,900 146,500 912 1173 no 237,700 1654 3076 no 200,000 2068 1608 no NNNWNNAN WWW WW AND 159,900 147 1454 no 499,900 3153 299 yes 265,500 1355 4054 no 289,900 2075 3002 yes C TABLE 9.12 Variable N Mean Std Dev price 100 155331 101262.2 bedrooms 100 3. 000 0. 651339 Sum of Mean Source DF Squares Square Model 1 . 575534E+11 1 . 575534E+11 Error 98 8. 575962E+11 8750981211 Total 99 1 . 01515E+12 Root MSE 93547 R-Square 0. 1652 Parameter Standard Variable Estimate Error Sig. Intercept -28412 14303 -0. 64 0. 5228 bedrooms 61248 14435 4. 24 <.0001>
Step by Step Solution
There are 3 Steps involved in it

Get step-by-step solutions from verified subject matter experts