

Question: Linear regression! In this lab we will start by learning to use the function provided by matlab to find the root. In this homework, we
Linear regression!
In this lab we will start by learning to use the function provided by matlab to find the root. In this homework, we are going to use linear regression to fit a line to a set of data.
Task:
First, you should download the data file from Canvas. You should save the file to the same folder on your computer as your code. The name of the file should be MEweekhwkdata.txt if Canvas changes it you should change it back
We will create a main script and a function. I recommend putting the function in the separate file in the same folder on your computer.
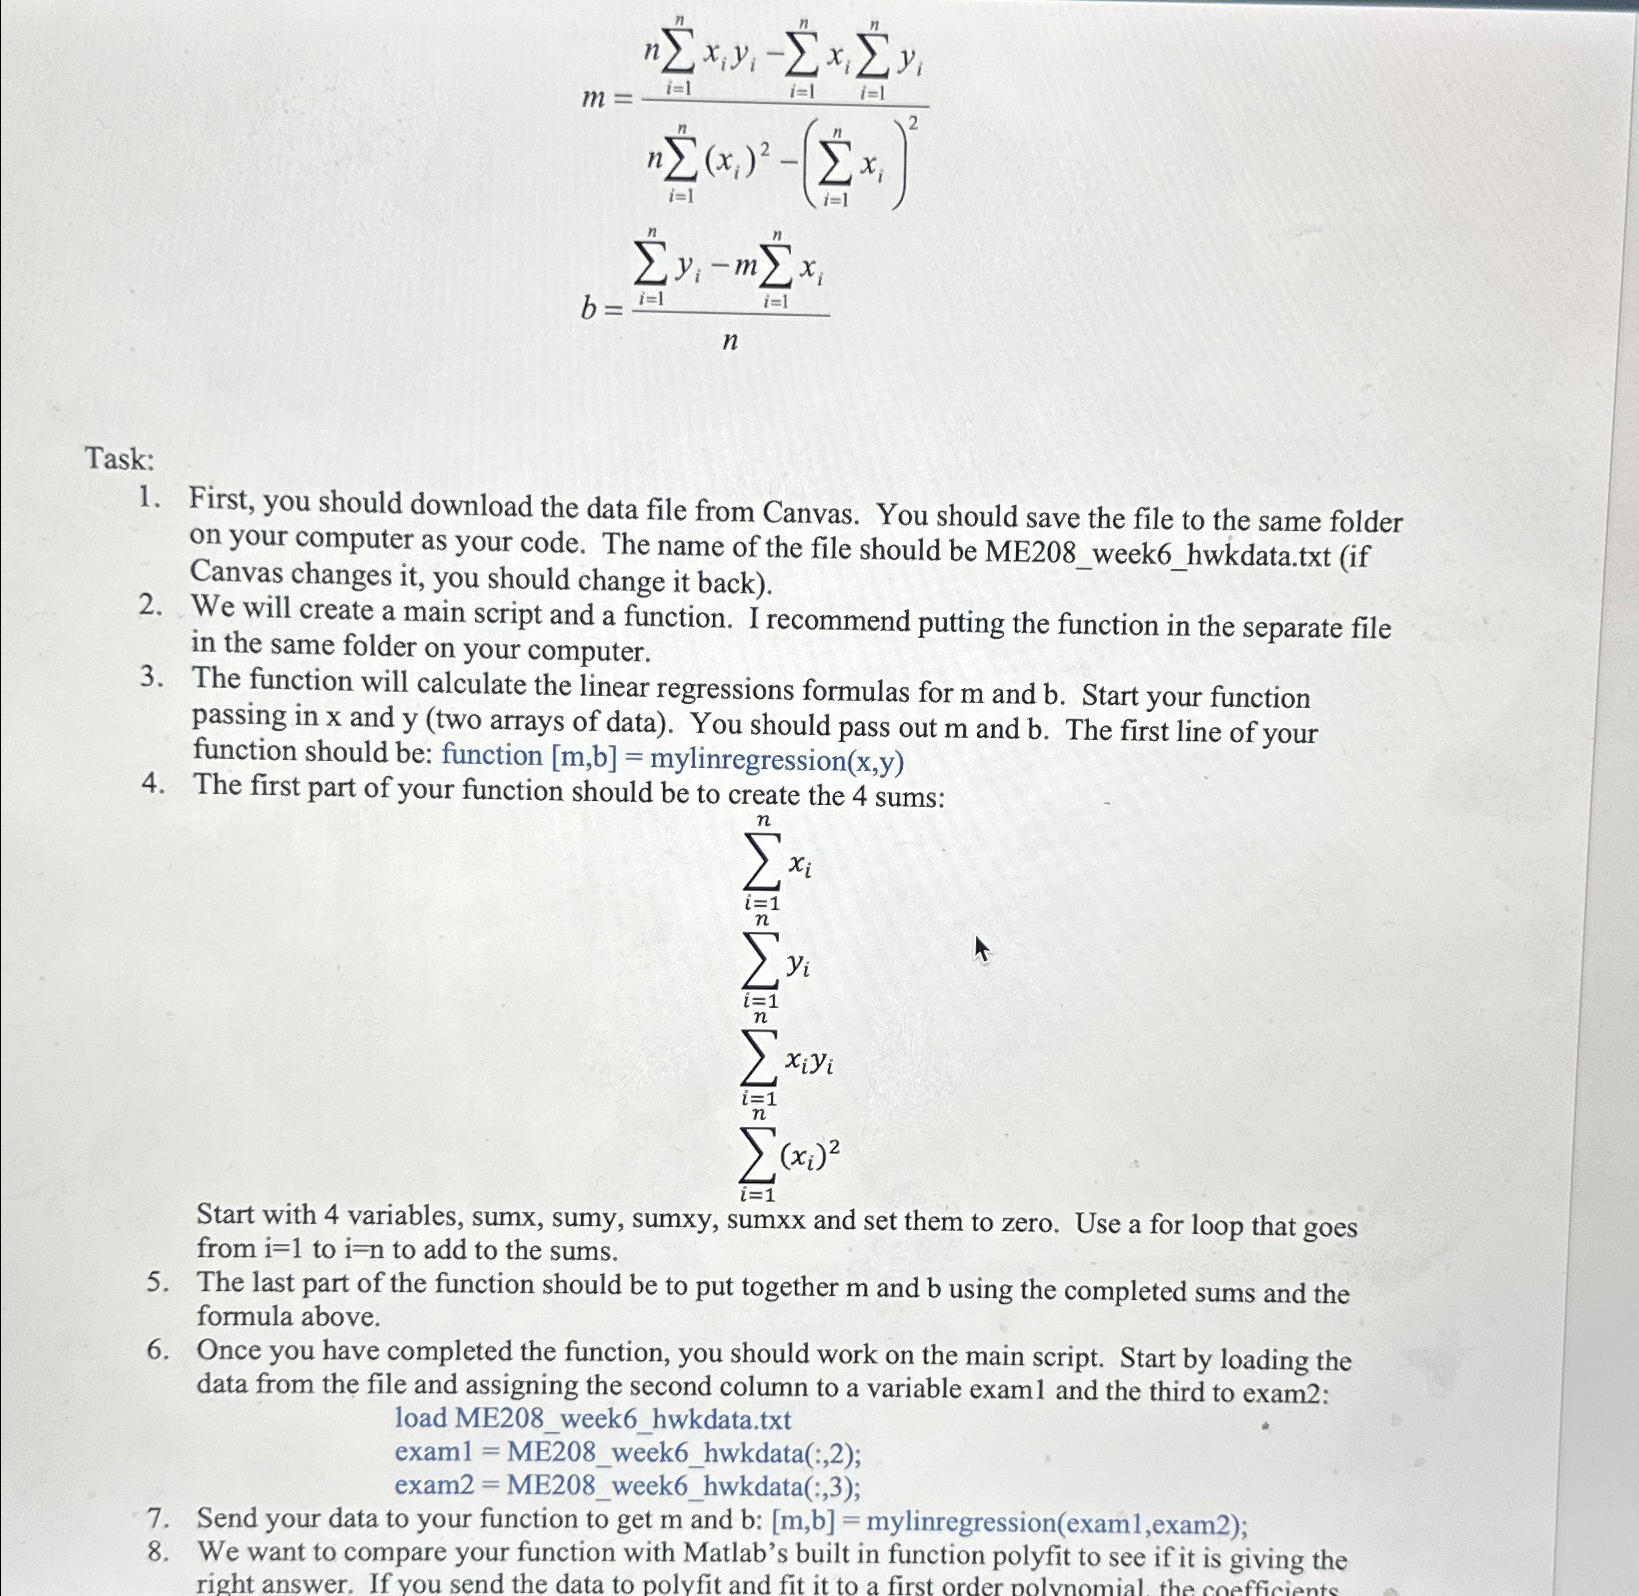
The function will calculate the linear regressions formulas for and Start your function passing in and two arrays of data You should pass out and The first line of your function should be: function mylinregression
The first part of your function should be to create the sums:
Start with variables, sumx, sumy, sumxy, sumxx and set them to zero. Use a for loop that goes from to to add to the sums.
The last part of the function should be to put together and using the completed sums and the formula above.
Once you have completed the function, you should work on the main script. Start by loading the data from the file and assigning the second column to a variable exam and the third to exam: load MEweekhwkdata.txt
exam MEweekhwkdata:;
exam MEweekhwkdata:;
Send your data to your function to get and : mylinregressionexamexam;
We want to compare your function with Matlab's built in function polyfit to see if it is giving the right answer. If you send the data to polyfit and fit it to a first order nolvnomial the coefficients of that polynomial should be equal to m and b: ppolyfitexamexam;
Using your new equations fitting a line to your data, create some new y data
yfitpexamp
yfitmexamb;
Plot your data using symbol exam vs exam and this fit data yfit and yfit using a red line to create two subplots one for the fit from your function and one for the fit from polyfit
Display your coefficients to the command window:
dispThe slope m was calculated as 'numstrm compared to 'numstrp 'using the matlab function'
dispThe intercept b was calculated as 'numstrb compared to 'numstrp 'using the matlab function'
Step by Step Solution
There are 3 Steps involved in it
1 Expert Approved Answer
Step: 1 Unlock

Question Has Been Solved by an Expert!
Get step-by-step solutions from verified subject matter experts
Step: 2 Unlock
Step: 3 Unlock