

Question: Linear Regression Model Homework Assignment An important application of predictive models is understanding sales. In this assignment, we will predict the monthly sales in the
Linear Regression Model Homework Assignment
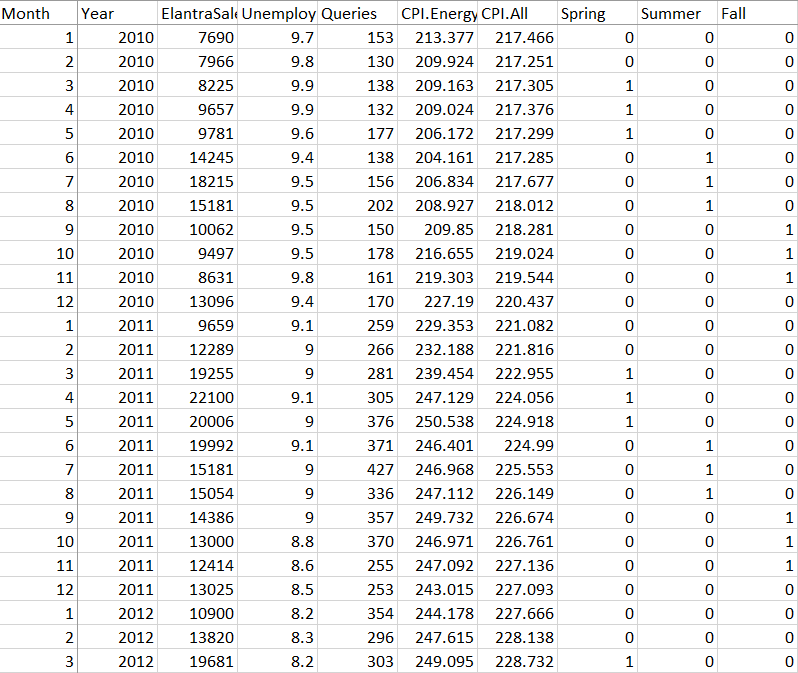
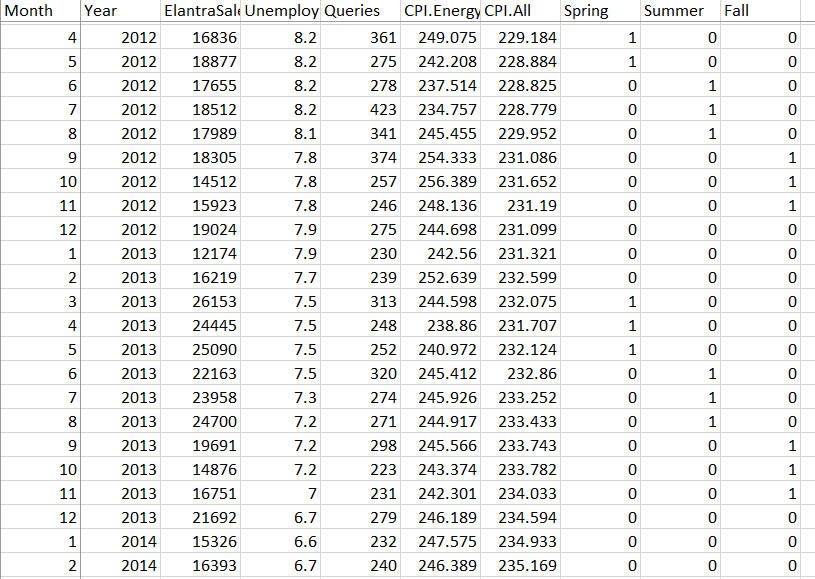
An important application of predictive models is understanding sales. In this assignment, we will predict the monthly sales in the United States of the Hyundai Elantra car. The variables are defined below:
| Variable | Description |
| Month | The observation month (1=January, 2=February, 3=March, etc.) |
| Year | The observation year |
| ElantraSales | The umber of the units of the Hyundai Elantra sold in the U.S. in the given month and year |
| Unemployment | The estimated unemployment rate as a percentage in the U.S. in the given month and year |
| Queries | A (normalized) approximation of the number of Google searches for "Hyundai Elantra" in the given month and year |
| CPI.All | The consumer price index for all products for the given month and year. This is a measure of the magnitude of the prices paid by consumer households for good and services |
| CPI.Energy | The monthly consumer price index for energy for the given month and year |
| Spring | 1 if Month=3, 4, 5; 0 otherwise |
| Summer | 1 if Month=6, 7, 8; 0 otherwise |
| Fall | 1 if Month=9, 10, 11; 0 otherwise |
Note: the variables Spring, Summer, and Fall are called the "dummy" variables. They are created to represent each season. When the values of Spring, Summer, and Fall are all equal to 0, it refers to Month=12, 1, 2. Therefore, we don't need an additional dummy variable to represent the Winter season.
Perform the following tasks:
- Split the Elantra.csv data into a training set and a testing set. The training set has all observations for 2010, 2011, and 2012, and the testing set has all observations for 2013 and 2014.
- Build a regression model based on the training set to predict monthly Elantra sales using Unemployment, Queries, CPI.Energy, and CPI.Allas the predicting variables.
- Present the fitted regression equation. (i.e., y=0.5+1.2X1+0.35X2+...)
- Provide the fitted coefficients table such as the one below:
| Coefficients | Standard Error | t Stat | P-value | Lower 95% | Upper 95% | |
| Intercept | ||||||
Unemployment Queries | ||||||
CPI.All CPI.Energy |
- Is the "sign" of the fitted coefficient of each variable consistent with what we would expect for its relation with the sales? (For example, a negative sign indicates the values of the predicting variable are negatively correlated with sales amount. If the sign of the variable CPI.ALL is positive, does it make sense to you?)
- What is the

Step by Step Solution
There are 3 Steps involved in it
1 Expert Approved Answer
Step: 1 Unlock

Question Has Been Solved by an Expert!
Get step-by-step solutions from verified subject matter experts
Step: 2 Unlock
Step: 3 Unlock