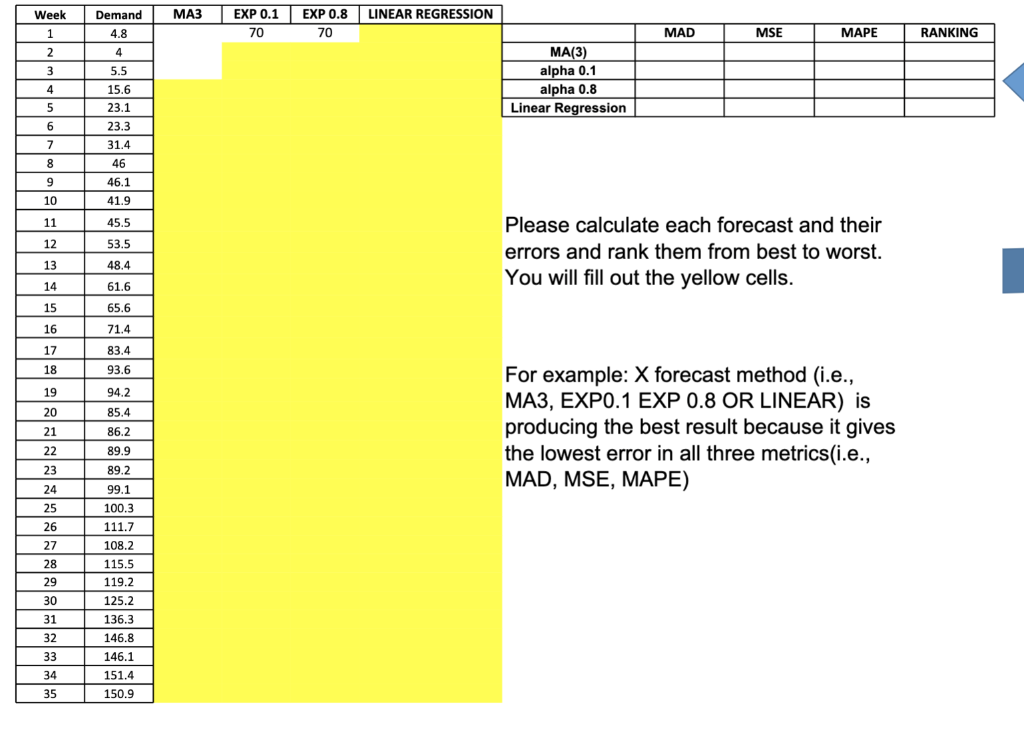
Question: LINEAR REGRESSION Week 1 2 Demand 4.8 EXP 0.1 70 EXP 0.8 70 MAD MSE MAPE RANKING 4 3 4 4 5 5.5 15.6 23.1

LINEAR REGRESSION Week 1 2 Demand 4.8 EXP 0.1 70

LINEAR REGRESSION Week 1 2 Demand 4.8 EXP 0.1 70 EXP 0.8 70 MAD MSE MAPE RANKING 4 3 4 4 5 5.5 15.6 23.1 23.3 31.4 46 MA(3) alpha 0.1 alpha 0.8 Linear Regression 6 7 8 46.1 9 10 41.9 11 45.5 12 53.5 Please calculate each forecast and their errors and rank them from best to worst. You will fill out the yellow cells. 13 48.4 14 61.6 15 65.6 71.4 16 17 83.4 18 93.6 19 20 94.2 85.4 86.2 21 22 For example: X forecast method (i.e., MA3, EXPO.1 EXP 0.8 OR LINEAR) is producing the best result because it gives the lowest error in all three metrics(i.e., MAD, MSE, MAPE) 23 24 25 26 27 89.9 89.2 99.1 100.3 111.7 108.2 115.5 119.2 125.2 28 29 30 31 136.3 146.8 32 33 146.1 """ 151.4 34 35 150.9

Step by Step Solution

There are 3 Steps involved in it

1 Expert Approved Answer
Step: 1 Unlock blur-text-image
Question Has Been Solved by an Expert!

Get step-by-step solutions from verified subject matter experts

Step: 2 Unlock
Step: 3 Unlock

Students Have Also Explored These Related General Management Questions!