

Question: Linear Trend Forecasting Conceptual Overview: Explore how the linear trend across time provides a forecast. For two or more time series points, we can fit
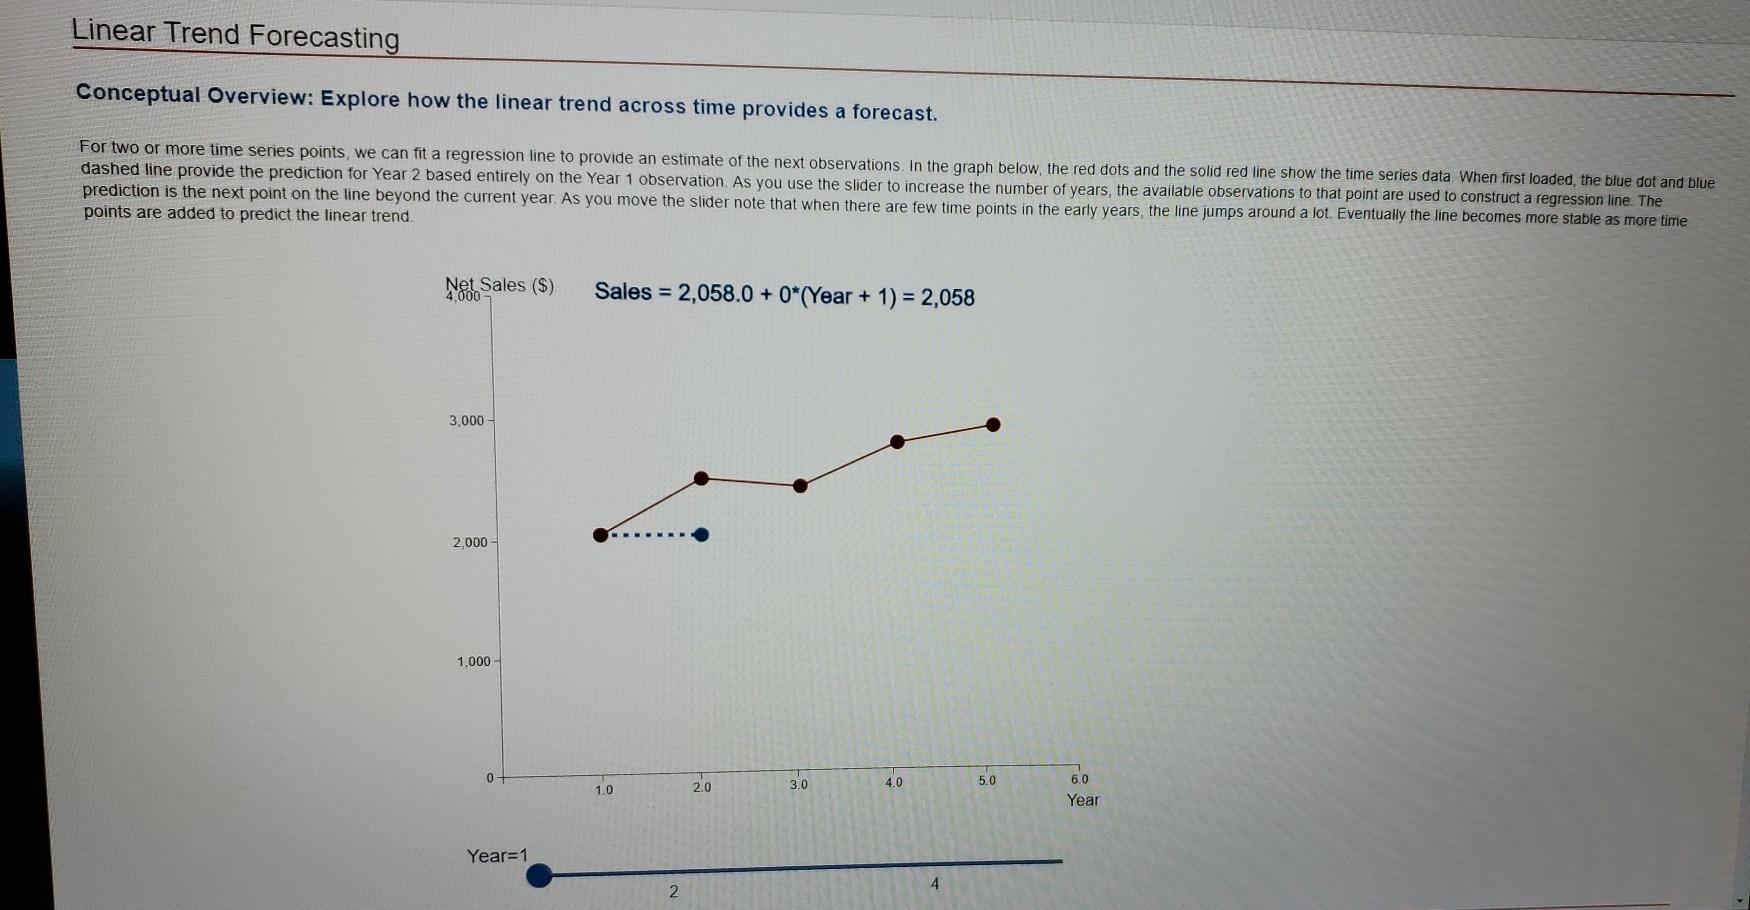
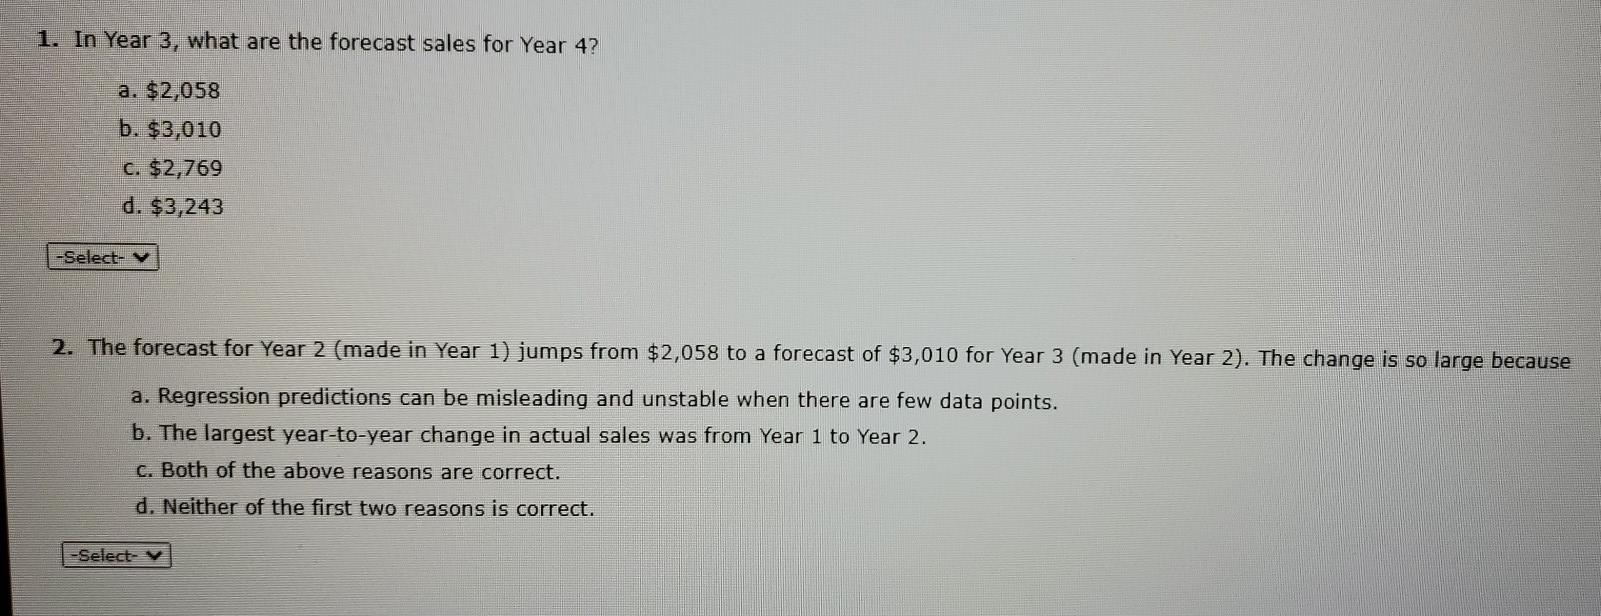
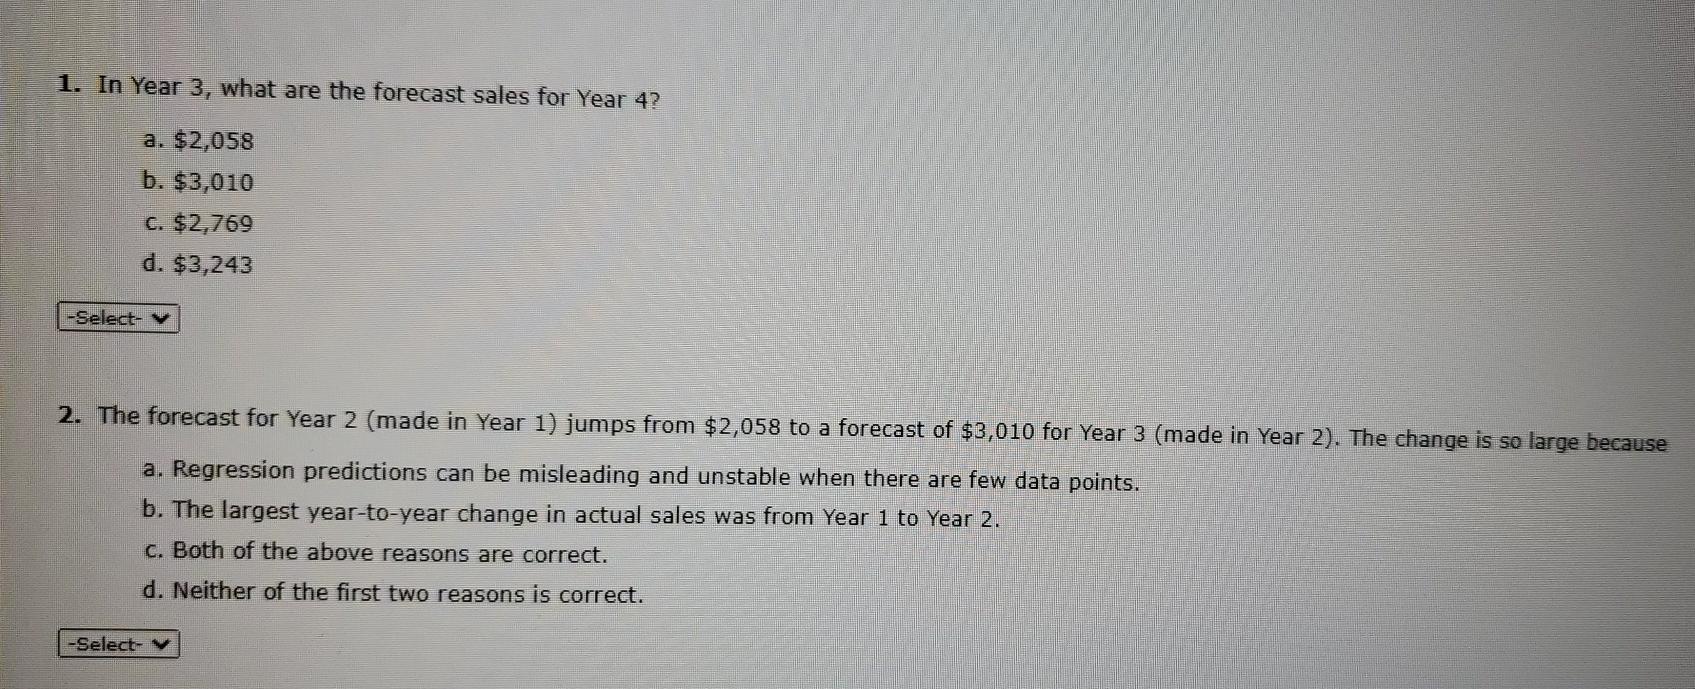
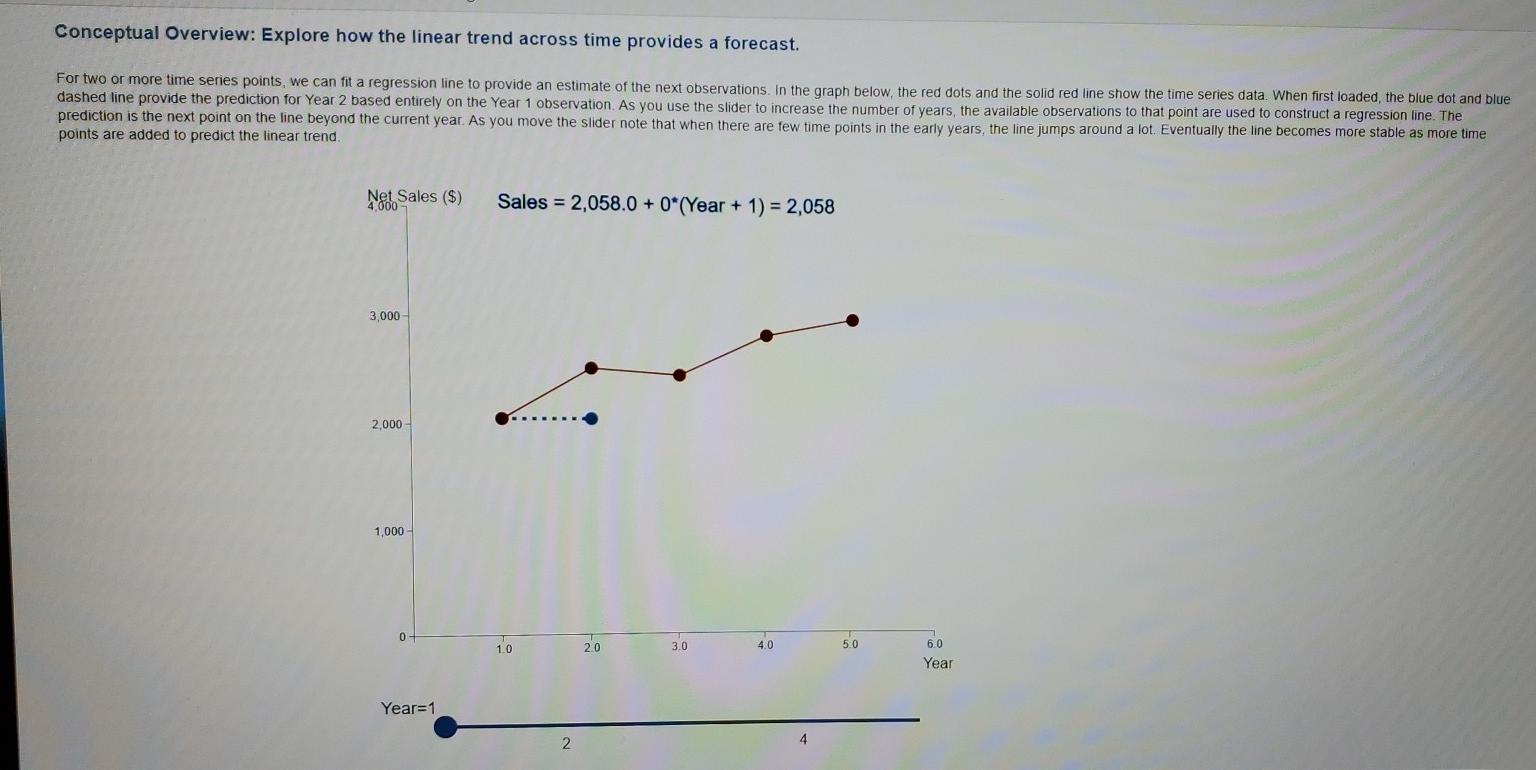
Linear Trend Forecasting Conceptual Overview: Explore how the linear trend across time provides a forecast. For two or more time series points, we can fit a regression line to provide an estimate of the next observations. In the graph below, the red dots and the solid red line show the time series data When first loaded, the blue dot and blue dashed line provide the prediction for Year 2 based entirely on the Year 1 observation. As you use the slider to increase the number of years, the available observations to that point are used to construct a regression line. The prediction is the next point on the line beyond the current year. As you move the slider note that when there are few time points in the early years, the line jumps around a lot. Eventually the line becomes more stable as more time points are added to predict the linear trend Net Sales ($) 4.000 Sales = 2,058.0 + 0*(Year + 1) = 2,058 3,000 2.000 1,000 - 0 2.0 3.0 4.0 1.0 5.0 6.0 Year Year=1 4 2 1. In Year 3, what are the forecast sales for Year 4? a. $2,058 b. $3,010 c. $2,769 d. $3,243 -Select- 2. The forecast for Year 2 (made in Year 1) jumps from $2,058 to a forecast of $3,010 for Year 3 (made in Year 2). The change is so large because a. Regression predictions can be misleading and unstable when there are few data points. b. The largest year-to-year change in actual sales was from Year 1 to Year 2. c. Both of the above reasons are correct. d. Neither of the first two reasons is correct. -Select 1. In Year 3, what are the forecast sales for Year 4? a. $2,058 b. $3,010 c. $2,769 d. $3,243 -Select- 2. The forecast for Year 2 (made in Year 1) jumps from $2,058 to a forecast of $3,010 for Year 3 (made in Year 2). The change is so large because a. Regression predictions can be misleading and unstable when there are few data points. b. The largest year-to-year change in actual sales was from Year 1 to Year 2. C. Both of the above reasons are correct. d. Neither of the first two reasons is correct. -Select- Conceptual Overview: Explore how the linear trend across time provides a forecast. For two or more time series points, we can fit a regression line to provide an estimate of the next observations. In the graph below, the red dots and the solid red line show the time series data When first loaded, the blue dot and blue dashed line provide the prediction for Year 2 based entirely on the Year 1 observation. As you use the slider to increase the number of years, the available observations to that point are used to construct a regression line. The prediction is the next point on the line beyond the current year. As you move the slider note that when there are few time points in the early years, the line jumps around a lot. Eventually the line becomes more stable as more time points are added to predict the linear trend. Net Sales ($) Sales = 2,058.0 + 0*(Year + 1) = 2,058 3,000 2,000 1,000 0 - 10 20 3.0 4.0 5.0 6.0 Year Year=1 4 2 Linear Trend Forecasting Conceptual Overview: Explore how the linear trend across time provides a forecast. For two or more time series points, we can fit a regression line to provide an estimate of the next observations. In the graph below, the red dots and the solid red line show the time series data When first loaded, the blue dot and blue dashed line provide the prediction for Year 2 based entirely on the Year 1 observation. As you use the slider to increase the number of years, the available observations to that point are used to construct a regression line. The prediction is the next point on the line beyond the current year. As you move the slider note that when there are few time points in the early years, the line jumps around a lot. Eventually the line becomes more stable as more time points are added to predict the linear trend Net Sales ($) 4.000 Sales = 2,058.0 + 0*(Year + 1) = 2,058 3,000 2.000 1,000 - 0 2.0 3.0 4.0 1.0 5.0 6.0 Year Year=1 4 2 1. In Year 3, what are the forecast sales for Year 4? a. $2,058 b. $3,010 c. $2,769 d. $3,243 -Select- 2. The forecast for Year 2 (made in Year 1) jumps from $2,058 to a forecast of $3,010 for Year 3 (made in Year 2). The change is so large because a. Regression predictions can be misleading and unstable when there are few data points. b. The largest year-to-year change in actual sales was from Year 1 to Year 2. c. Both of the above reasons are correct. d. Neither of the first two reasons is correct. -Select 1. In Year 3, what are the forecast sales for Year 4? a. $2,058 b. $3,010 c. $2,769 d. $3,243 -Select- 2. The forecast for Year 2 (made in Year 1) jumps from $2,058 to a forecast of $3,010 for Year 3 (made in Year 2). The change is so large because a. Regression predictions can be misleading and unstable when there are few data points. b. The largest year-to-year change in actual sales was from Year 1 to Year 2. C. Both of the above reasons are correct. d. Neither of the first two reasons is correct. -Select- Conceptual Overview: Explore how the linear trend across time provides a forecast. For two or more time series points, we can fit a regression line to provide an estimate of the next observations. In the graph below, the red dots and the solid red line show the time series data When first loaded, the blue dot and blue dashed line provide the prediction for Year 2 based entirely on the Year 1 observation. As you use the slider to increase the number of years, the available observations to that point are used to construct a regression line. The prediction is the next point on the line beyond the current year. As you move the slider note that when there are few time points in the early years, the line jumps around a lot. Eventually the line becomes more stable as more time points are added to predict the linear trend. Net Sales ($) Sales = 2,058.0 + 0*(Year + 1) = 2,058 3,000 2,000 1,000 0 - 10 20 3.0 4.0 5.0 6.0 Year Year=1 4 2
Step by Step Solution
There are 3 Steps involved in it

Get step-by-step solutions from verified subject matter experts