

Question: Link to google drive with the R studio template and data sets: https://drive.google.com/drive/folders/1-0vAauUKLg-njx3WlnY3Kooj-0D_VwC8?usp=sharing Use the T distribution for all problems involving means, even if the
Link to google drive with the R studio template and data sets:
https://drive.google.com/drive/folders/1-0vAauUKLg-njx3WlnY3Kooj-0D_VwC8?usp=sharing
- Use the T distribution for all problems involving means, even if the sample size is large. Use t.test for any problems with raw data. Use tsum. test if you only have summary data. Do NOT use z.test or zsum. test.
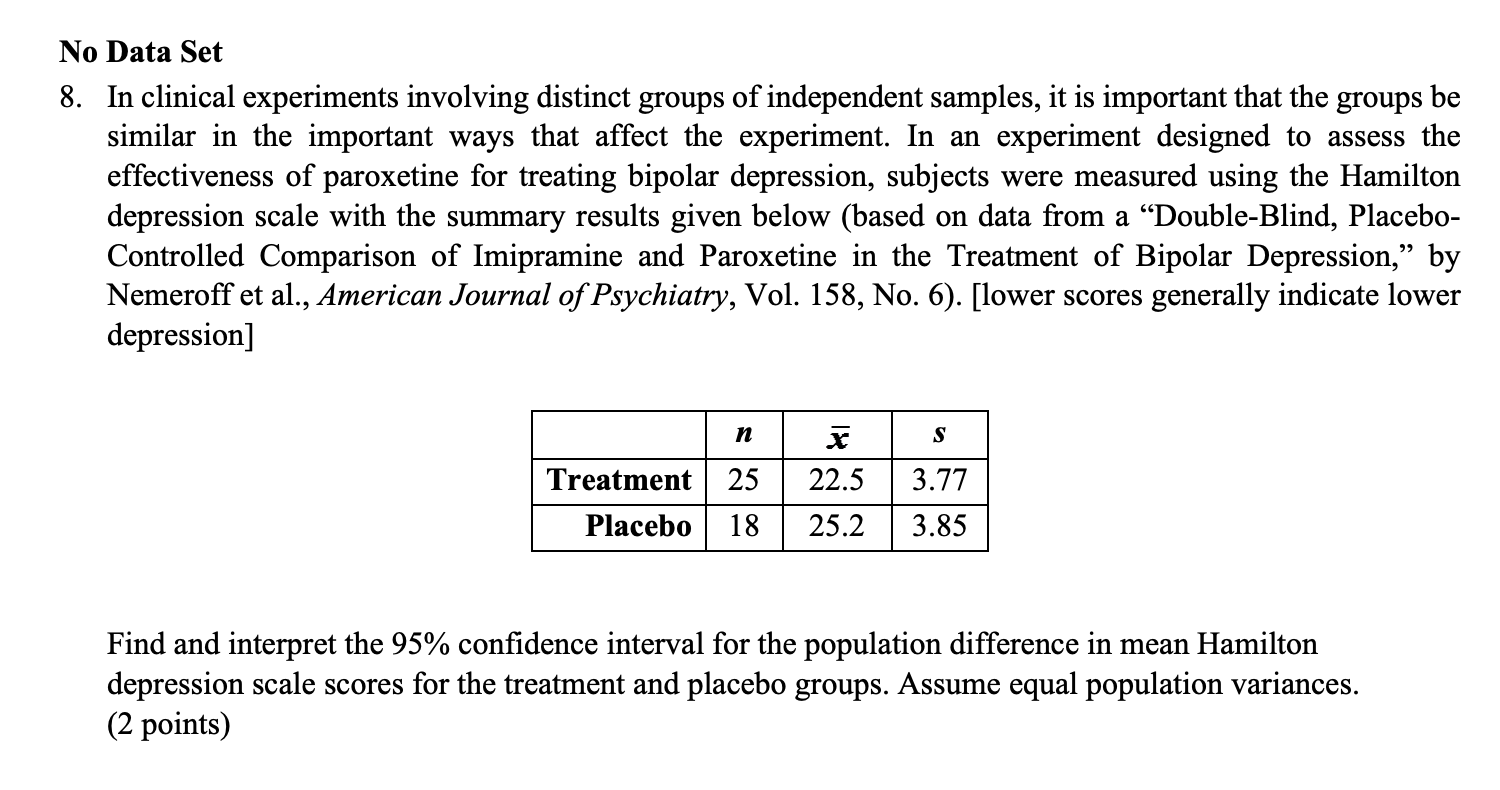
No Data Set 8. In clinical experiments involving distinct groups of independent samples, it is important that the groups be similar in the important ways that affect the experiment. In an experiment designed to assess the effectiveness of paroxetine for treating bipolar depression, subjects were measured using the Hamilton depression scale with the summary results given below (based on data from a \"Double-Blind, Placebo- Controlled Comparison of Imipramine and Paroxetine in the Treatment of Bipolar Depression,\" by Nemeroff et a1., American Journal ofPsychiatnz, Vol. 158, No. 6). [lower scores generally indicate lower depression] Find and interpret the 95% condence interval for the population difference in mean Hamilton depression scale scores for the treatment and placebo groups. Assume equal population variances. (2 points)
Step by Step Solution
There are 3 Steps involved in it

Get step-by-step solutions from verified subject matter experts