Question: Lion Mane Income Statement In Millionsn except per share items. For the Fiscal Period Ending 12 months 12 months 12 months 12 months Dec-31-2018 Dec-31-2019
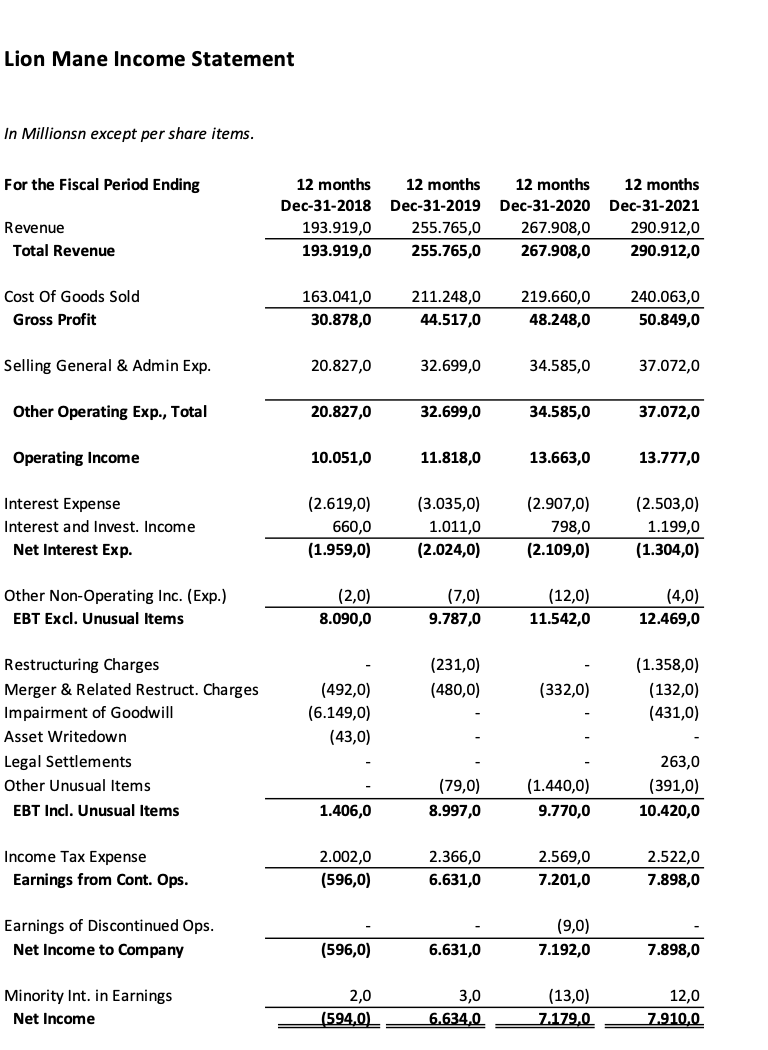
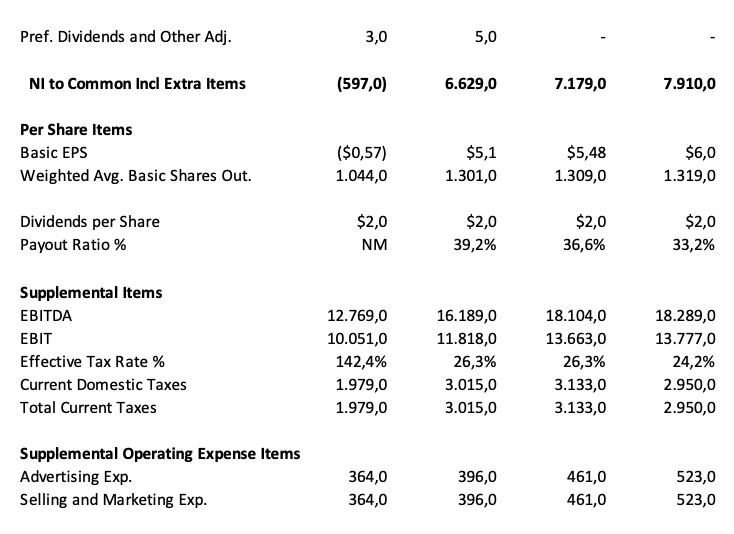
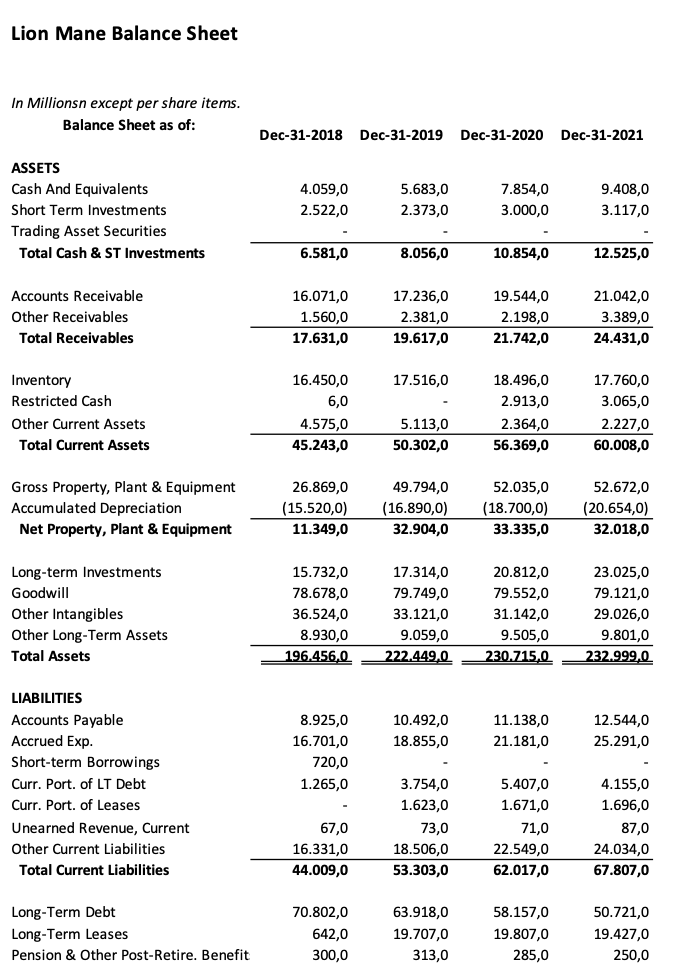
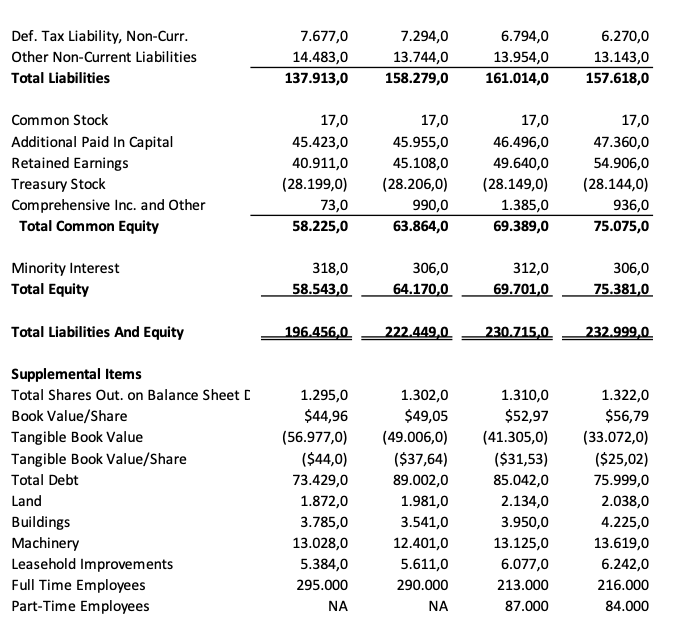
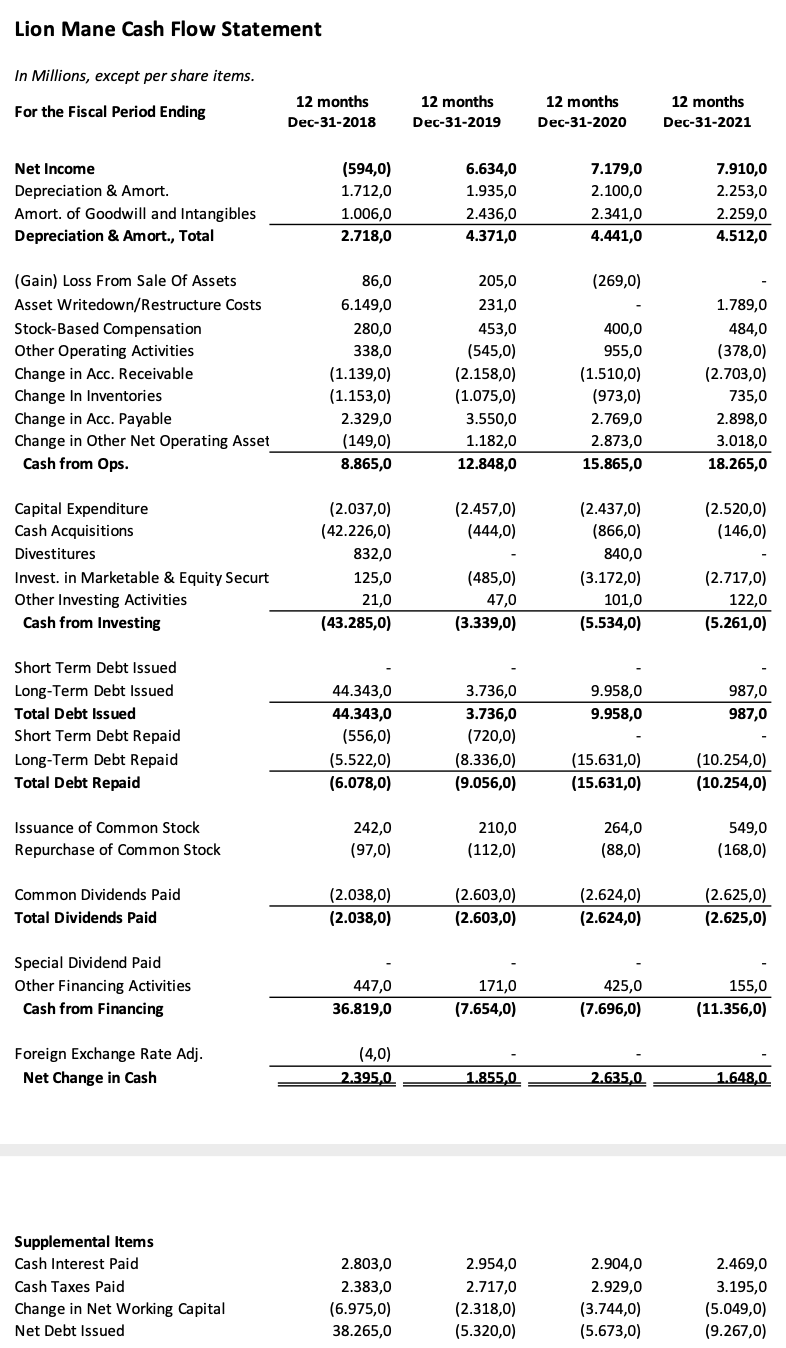
Lion Mane Income Statement In Millionsn except per share items. For the Fiscal Period Ending 12 months 12 months 12 months 12 months Dec-31-2018 Dec-31-2019 Dec-31-2020 Dec-31-2021 Revenue 193.919,0 255.765,0 267.908,0 290.912,0 Total Revenue 193.919,0 255.765,0 267.908,0 290.912,0 Cost Of Goods Sold 163.041,0 211.248,0 219.660,0 240.063,0 Gross Profit 30.878,0 44.517,0 48.248,0 50.849,0 Selling General & Admin Exp. 20.827,0 32.699,0 34.585,0 37.072,0 Other Operating Exp., Total 20.827,0 32.699,0 34.585,0 37.072,0 Operating Income 10.051,0 11.818,0 13.663,0 13.777,0 Interest Expense (2.619,0) (3.035,0) (2.907,0) (2.503,0) Interest and Invest. Income 660,0 1.011,0 798,0 1.199,0 Net Interest Exp. (1.959,0) (2.024,0) (2.109,0) (1.304,0) Other Non-Operating Inc. (Exp.) (2,0) (7,0) (12,0) (4,0) EBT Excl Unusual Items 8.090,0 9.787,0 11.542,0 12.469,0 Restructuring Charges (231,0) (1.358,0) Merger & Related Restruct. Charges (492,0) (480,0) (332,0) (132,0) Impairment of Goodwill (6.149,0) (431,0) Asset Writedown (43,0) Legal Settlements 263,0 Other Unusual Items (79,0) (1.440,0) (391,0) EBT Incl. Unusual Items 1.406,0 8.997,0 9.770,0 10.420,0 Income Tax Expense 2.002,0 2.366,0 2.569,0 2.522,0 Earnings from Cont. Ops. (596,0) 6.631,0 7.201,0 7.898,0 Earnings of Discontinued Ops. (9,0) Net Income to Company (596,0) 6.631,0 7.192,0 7.898,0 Minority Int. in Earnings 2,0 3,0 (13,0) 12,0 Net Income (594.0) 6.634,0 7.179,0 7.910,0Pref. Dividends and Other Adj. NI t0 C0mm0n Incl Extra Items Per Share Items Basic EPS Weighted Avg. Basic Shares Out. Dividends per Share Payout Ratio 96 Supplemental Items EBITDA EBIT Effective Tax Rate 96 Current Domestic Taxes Total Current Taxes Supplemental Operating Expense Items Advertising Exp. Selling and Marketing Exp. 3,0 (59?,0} [$0,510 1.044,0 52,0 N M 12.76930 10.051 ,0 142,496 1.9?9,0 1.9?9,0 364,0 364,0 5,0 6. 629 ,0 $5.1 1.301,0 $2,0 39,296 16.189,0 11.818,0 26,396 3.015,0 3.015,0 396,0 396,0 7.179,!) $5,48 1.309,0 52,0 36,696 18.104,0 13.663,0 26,396 3.133,0 3.133,0 461,0 461,0 7.910,0 $5.0 1 .3 19,0 $2,0 33,296 18 .2 89,0 13 .2210 24,296 2 350,0 2 350,0 523,0 523,0 Lion Mane Balance Sheet In Millionsn except per share items. Balance Sheet as of: Dec-31-2018 Dec-31-2019 Dec-31-2020 Dec-31-2021 ASSETS Cash And Equivalents 4.059,0 5.683,0 7.854,0 9.408,0 Short Term Investments 2.522,0 2.373,0 3.000,0 3.117,0 Trading Asset Securities Total Cash & ST Investments 6.581,0 8.056,0 10.854,0 12.525,0 Accounts Receivable 16.071,0 17.236,0 19.544,0 21.042,0 Other Receivables 1.560,0 2.381,0 2.198,0 3.389,0 Total Receivables 17.631,0 19.617,0 21.742,0 24.431,0 Inventory 16.450,0 17.516,0 18.496,0 17.760,0 Restricted Cash 6,0 2.913,0 3.065,0 Other Current Assets 4.575,0 5.113,0 2.364,0 2.227,0 Total Current Assets 45.243,0 50.302,0 56.369,0 60.008,0 Gross Property, Plant & Equipment 26.869,0 49.794,0 52.035,0 52.672,0 Accumulated Depreciation (15.520,0) (16.890,0) (18.700,0) (20.654,0) Net Property, Plant & Equipment 11.349,0 32.904,0 33.335,0 32.018,0 Long-term Investments 15.732,0 17.314,0 20.812,0 23.025,0 Goodwill 78.678,0 79.749,0 79.552,0 79.121,0 Other Intangibles 36.524,0 33.121,0 31.142,0 29.026,0 Other Long-Term Assets 8.930,0 9.059,0 9.505,0 9.801,0 Total Assets 196.456,0 222.449.0 230.715,0 232.999,0 LIABILITIES Accounts Payable 8.925,0 10.492,0 11.138,0 12.544,0 Accrued Exp. 16.701,0 18.855,0 21.181,0 25.291,0 Short-term Borrowings 720,0 Curr. Port. of LT Debt 1.265,0 3.754,0 5.407,0 4.155,0 Curr. Port. of Leases 1.623,0 1.671,0 1.696,0 Unearned Revenue, Current 67,0 73,0 71,0 87,0 Other Current Liabilities 16.331,0 18.506,0 22.549,0 24.034,0 Total Current Liabilities 44.009,0 53.303,0 62.017,0 67.807,0 Long-Term Debt 70.802,0 63.918,0 58.157,0 50.721,0 Long-Term Leases 642,0 19.707,0 19.807,0 19.427,0 Pension & Other Post-Retire. Benefit 300,0 313,0 285,0 250,0Def. Tax Liability, Non-Curr. 7.677,0 7.294,0 6.794,0 6.270,0 Other Non-Current Liabilities 14.483,0 13.744,0 13.954,0 13.143,0 Total Liabilities 137.913,0 158.279,0 161.014,0 157.618,0 Common Stock 17,0 17,0 17,0 17,0 Additional Paid In Capital 45.423,0 45.955,0 46.496,0 47.360,0 Retained Earnings 40.911,0 45.108,0 49.640,0 54.906,0 Treasury Stock (28.199,0) (28.206,0) (28.149,0) (28.144,0) Comprehensive Inc. and Other 73,0 990,C 1.385,0 936,0 Total Common Equity 58.225,0 63.864,0 69.389,0 75.075,0 Minority Interest 318,0 306,0 312,0 306,0 Total Equity 58.543,0 64.170,0 69.701,0 75.381,0 Total Liabilities And Equity 196.456.0 222.449.0 230.715,0 232.999.0 Supplemental Items Total Shares Out. on Balance Sheet C 1.295,0 1.302,0 1.310,0 1.322,0 Book Value/Share $44,96 $49,05 $52,97 $56,79 Tangible Book Value (56.977,0) (49.006,0) (41.305,0) (33.072,0) Tangible Book Value/Share ($44,0) ($37,64) ($31,53) ($25,02) Total Debt 73.429,0 89.002,0 85.042,0 75.999,0 Land 1.872,0 1.981,0 2.134,0 2.038,0 Buildings 3.785,0 3.541,0 3.950,0 4.225,0 Machinery 13.028,0 12.401,0 13.125,0 13.619,0 Leasehold Improvements 5.384,0 5.611,0 6.077,0 6.242,0 Full Time Employees 295.000 290.000 213.000 216.000 Part-Time Employees NA NA 87.000 84.000Lion Mane Cash Flow Statement in Millions, except per share items. For the Fiscal Period Ending Net Income Depreciation 81 Amort. Amort. of Goodwill and Intangibles Depreciation 81 ArnorL, Total {Gain} Loss From Sale Of Assets Asset Writ edown,' Restructure Costs Stock Ba sed Com pensati on Other Operating Activities Change in Acc. Receivable Change In Inventories Change in Acc. Pavable Change in Other Net Operating Asset Cash from Ops. Capital Expenditure Cash Acquisitions Divestitures Invest. in Marketable 8: Equitvr Securt Other Investing Activities Cash from Investing Short Term Debt Issued LongTerm Debt Issued Total Debt Issued Short Term Debt Repaid LongTerm Debt Repaid Total Debt Repaid Issuance of Common Stock Repurchase of Com mon Stock Common Dividends Paid Total Dividends Paid Special Dividend Paid Other Financing Activities Cash from Financing Foreign Exchange Rate Adj. Net Change in Cash Supplemental Items Cash Interest Paid Cash Taxes Paid Change in Net Working Capital Net Debt Issued 12 months 12 months 12 months 12 months Dec- 31- 2013 DEE-31-2019 Dec-3 1-2020 Devil-2021 {594,0} 6.6343 2. 129,0 2.9103 1.2123 1.9353 2.1003 2.2533 1.0063 2.4363 2.3413 2.2593 2.2133 4.32 1,0 4.4413 4.5123 88,0 205,0 {289,01 - 6.1493 231,0 - 1.2893 280,0 453,0 400,0 484,0 338,0 {545,01 955,0 {328,01 {1139,01 {2158,01 {1510,01 {2203,01 {1153,01 {1025,01 {923,01 235,0 2.3293 3.5503 2.2693 2.8983 (1493] 1.1823 2.8233 3.0183 3.3653 12.3433 1 5.3653 13. 265,0 {2032,01 {2452,01 {2432,01 {2520,01 {42.228,01 {444,01 {888,01 {148,01 8323 840,0 - 125,0 {485,01 {3122,01 {2212,01 213 42,0 101,0 122,0 {43.2353} {3939,01 {5534,01 {5.2613} 44.3433 3.2363 9.9583 98 2,0 44.3433 3.2363 9.9533 932,0 {558,01 {220,01 - - {5522,01 [8.3363] {15.63131 {10.25401 {6.0283} {9.0563} {15.6313} {10,254,01 2423 2103 264,0 549,0 {92,01 {112,01 {88,01 {188,01 {2038,01 {2803,01 {2824,01 {2825,01 {2038,01 {2803,01 [2.62-4.01 (2.6253) 4423 1213 4253 1553 36.3193 {2854,01 {2898,01 {11,358,111 [4.01 - AA 2.8030 23830 {8925,01 38.285,0 2.954,0 2.2120 {2318,01 {5320,01 AA 2.904,0 2929,11 {3244,01 {5823,01 2.4693 3195,11 {5049,01 {9.2623}
Step by Step Solution
There are 3 Steps involved in it
1 Expert Approved Answer
Step: 1 Unlock
Question Has Been Solved by an Expert!
Get step-by-step solutions from verified subject matter experts
Step: 2 Unlock
Step: 3 Unlock
Students Have Also Explored These Related Finance Questions!