Question: LIQUIDITY - PROFITABILITY TRADEOFF: AN EMPIRICAL INVESTIGATION IN AN EMERGING MARKET Abuzar M. A. Eljelly This study empirically examines the relation between profitability and liquidity,
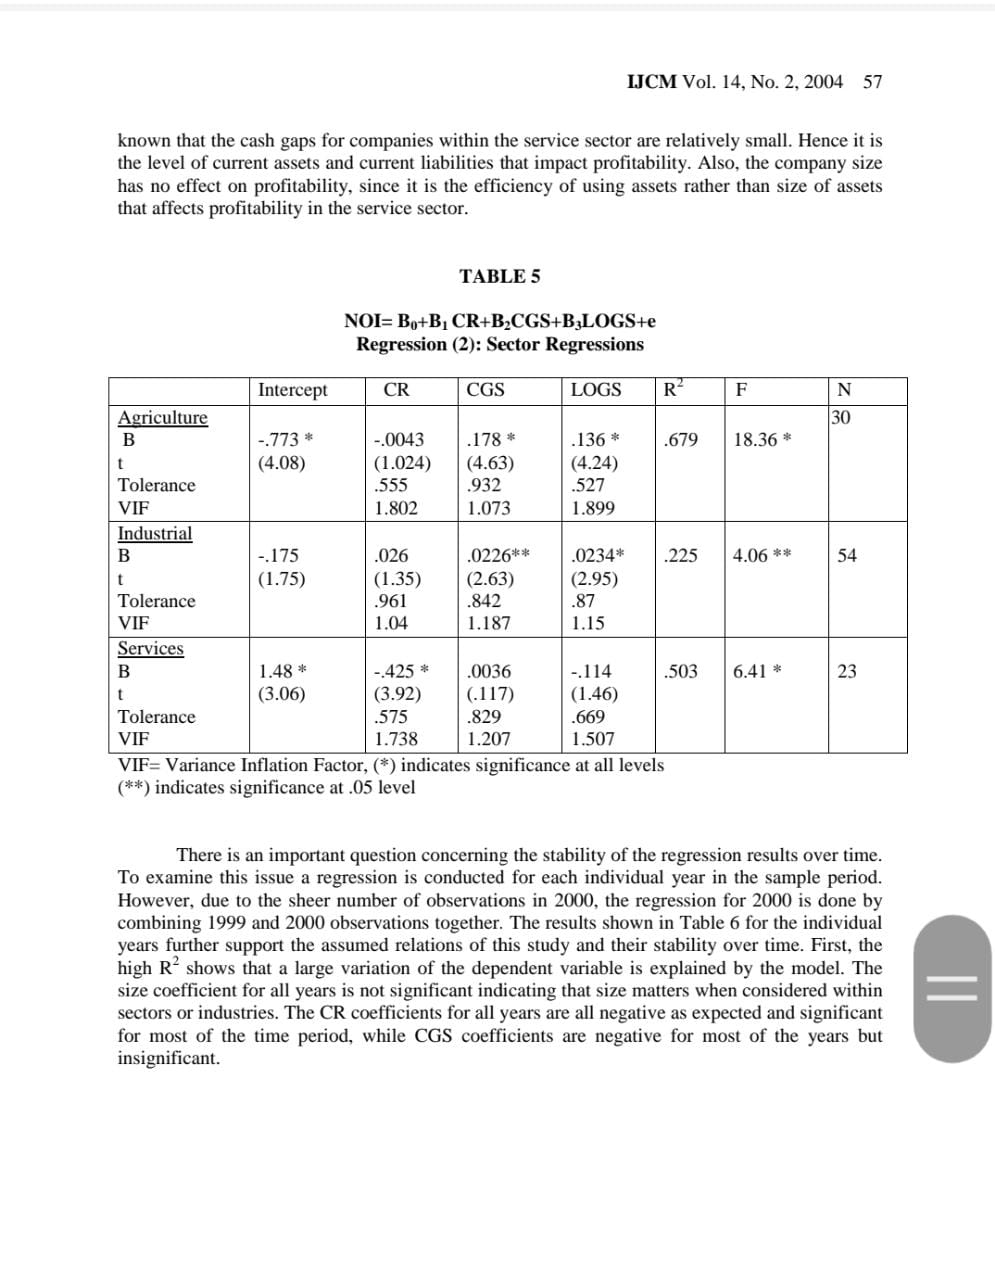
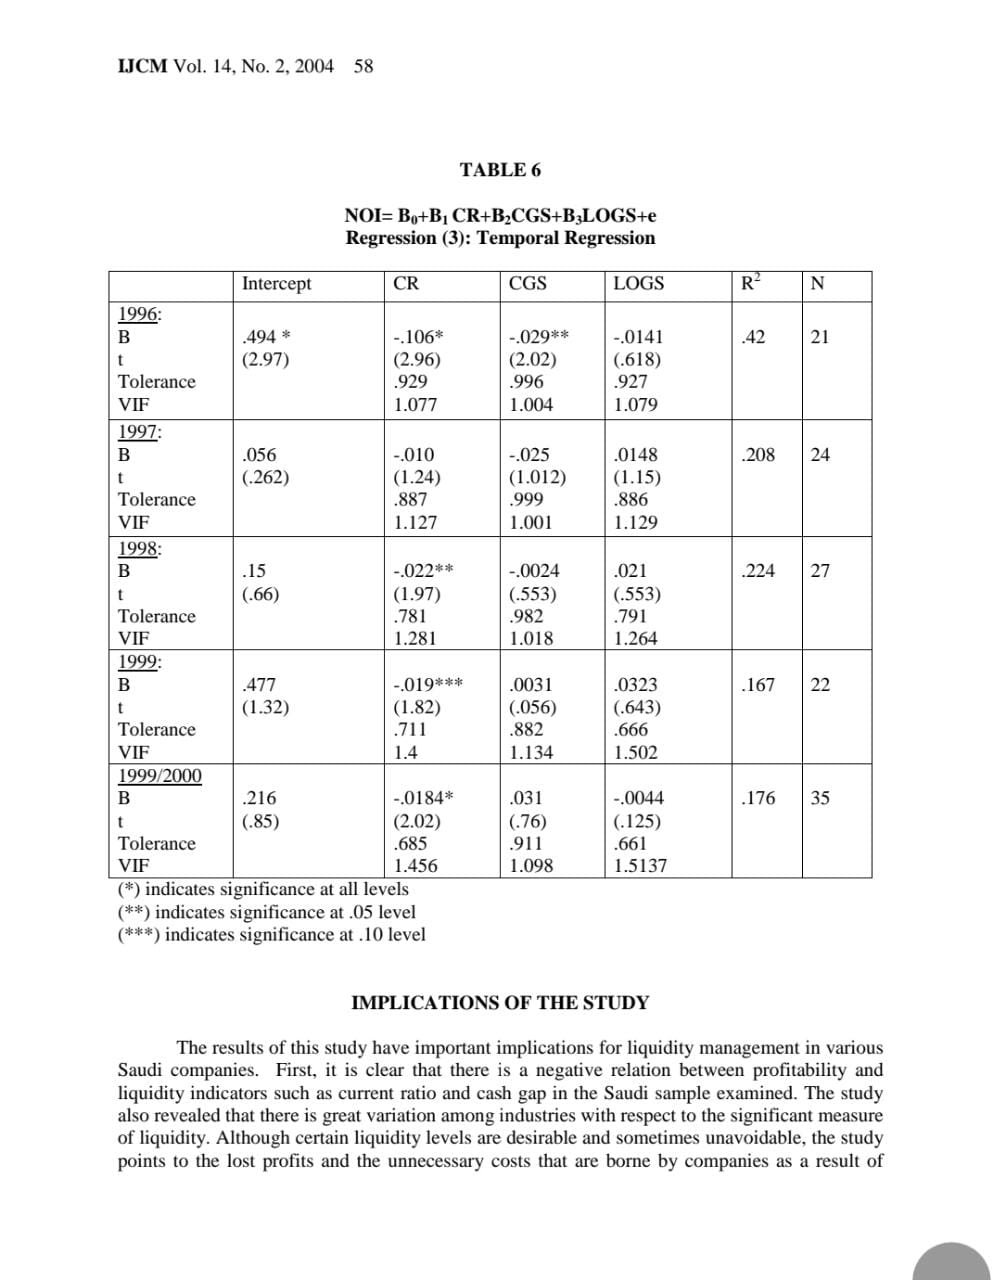
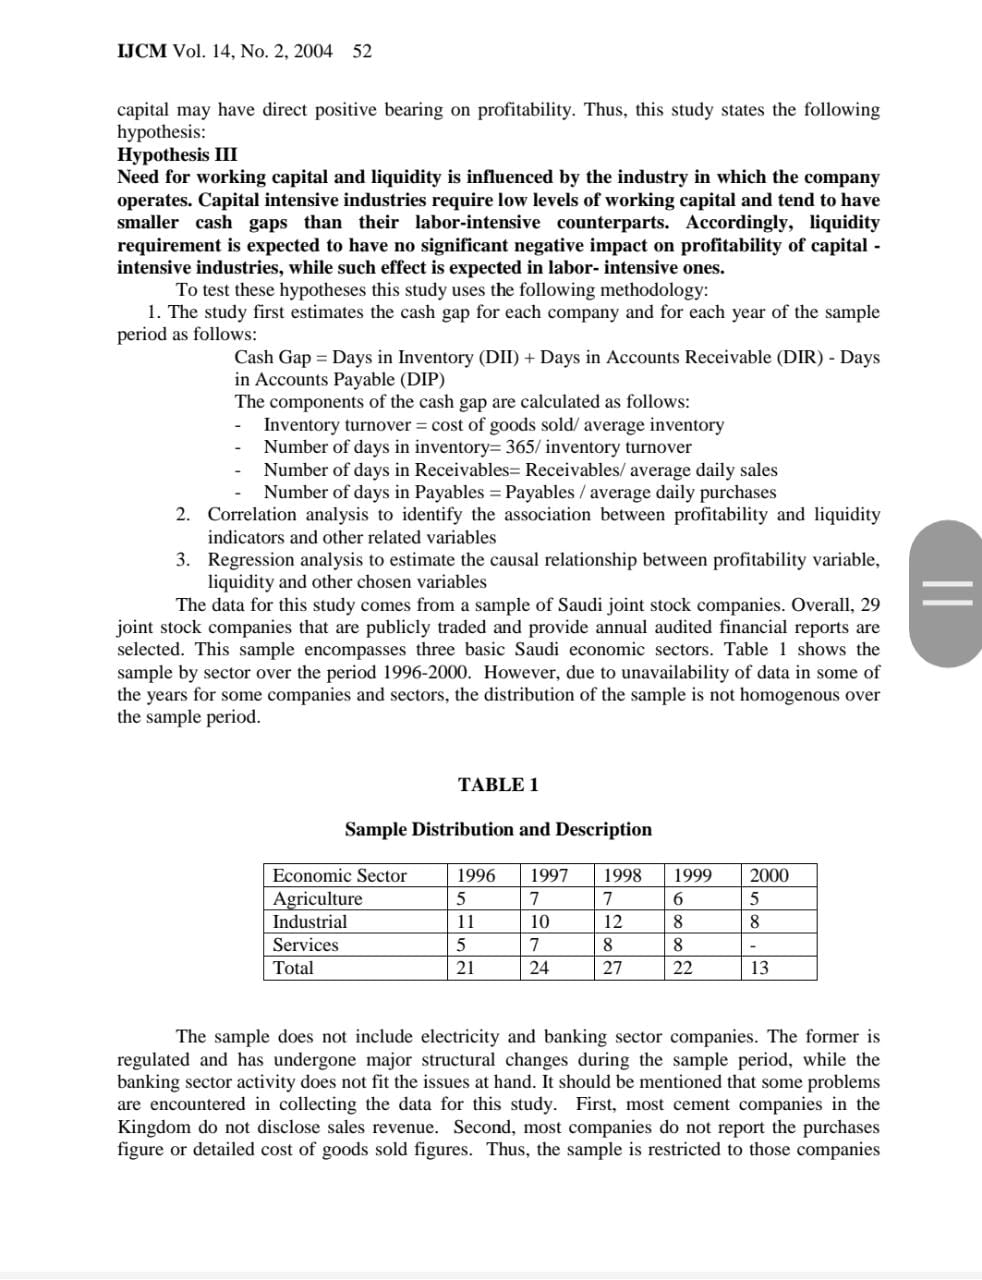
LIQUIDITY - PROFITABILITY TRADEOFF: AN EMPIRICAL INVESTIGATION IN AN EMERGING MARKET Abuzar M. A. Eljelly This study empirically examines the relation between profitability and liquidity, as measured by current ratio and cash gap (cash conversion cycle) on a sample of joint stock companies in Saudi Arabia. Using correlation and regression analysis the study found significant negative relation between the firm's profitability and its liquidity level, as measured by current ratio. This relationship is more evident in firms with high current ratios and longer cash conversion cycles. At the industry level, however, the study found that the cash conversion cycle or the cash gap is of more importance as a measure of liquidity than current ratio that affects profitability. The size variable is also found to have significant effect on profitability at the industry level. Finally, the results are stable over the period under study. INTRODUCTION Efficient liquidity management involves planning and controlling current assets and current liabilities in such a manner that eliminates the risk of the inability to meet due short-term obligations, on one hand, and avoids excessive investment in these assets, on the other. This is due in part to the reduction of the probability of running out of cash in the presence of liquid assets. The working capital approach to liquidity management has long been the prominent technique used to plan and control liquidity. The working capital includes all the items shown on a company's balance sheet as short-term or current assets, while net working capital excludes current liabilities. This measure is considered a useful tool in accessing the availability of funds to meet current operations of companies. However, instead of using working capital as a measure of liquidity, many analysts advocate the use of current and quick ratios, which have the advantage of making temporal or cross sectional comparison possible. However, the ultimate measure of the efficiency of liquidity planning and control is the effect it has on profits and shareholders' value. Thus, this study attempts to examine the relation between liquidity and profitability using a sample of Saudi joint stock companies. Second, the study aims at directing the attention to the importance of active management of liquidity. This aspect is more important given the number of non-profitable Saudi companies, and the dire need to improve profitability. To carry out these objectives the remainder of this paper is organized as follows: the next section reviews the literature for relevant theoretical and empirical work on liquidity and cash management and its effect on profitability. Section three describes the sample and the methodology followed in this study. Section four portrays and discusses the statistical results, IJCM Vol. 14, No. 2, 2004 49 while section five explores the implications of the study. The final section, section six, concludes the paper.IJCM Vol. 14, No. 2, 2004 57 known that the cash gaps for companies within the service sector are relatively small. Hence it is the level of current assets and current liabilities that impact profitability. Also, the company size has no effect on profitability, since it is the efficiency of using assets rather than size of assets that affects profitability in the service sector. TABLE 5 NOI= Bo+B, CR+B2CGS+BLOGS+e Regression (2): Sector Regressions Intercept CR CGS LOGS R F N Agriculture 30 B -.773 * -.0043 178 * .136 * 679 18.36 * (4.08) (1.024) (4.63) (4.24) Tolerance 555 932 .527 VIF 1.802 1.073 1.899 Industrial B -.175 .026 0226** .0234* 225 4.06 * * 54 (1.75) (1.35) (2.63) (2.95) Tolerance .961 .842 .87 VIF 1.04 1.187 1.15 Services B 1.48 * -.425 * .0036 -.114 503 6.41 * 23 (3.06) (3.92) (.117) (1.46) Tolerance 575 829 669 IF 1.738 1.207 1.507 VIF= Variance Inflation Factor, (*) indicates significance at all levels **) indicates significance at .05 level There is an important question concerning the stability of the regression results over time. To examine this issue a regression is conducted for each individual year in the sample period. However, due to the sheer number of observations in 2000, the regression for 2000 is done by combining 1999 and 2000 observations together. The results shown in Table 6 for the individual years further support the assumed relations of this study and their stability over time. First, the high R shows that a large variation of the dependent variable is explained by the model. The size coefficient for all years is not significant indicating that size matters when considered within sectors or industries. The CR coefficients for all years are all negative as expected and significant for most of the time period, while CGS coefficients are negative for most of the years but insignificant.IJCM Vol. 14, No. 2, 2004 58 TABLE 6 NOI= Bo+B, CR+BCGS+BLOGSte Regression (3): Temporal Regression Intercept CR CGS LOGS R N 1996: B 494 * .106* -.029** -.0141 .42 21 (2.97) (2.96) (2.02) (.618) Tolerance .929 .996 927 VIF 1.077 1.004 1.079 1997: B 056 .010 -.025 .0148 .208 24 (.262) (1.24) (1.012) (1.15) Tolerance .887 999 886 VIF 1.127 1.001 1.129 1998: B .15 -.022** -.0024 021 .224 27 (.66) (1.97) (.553) (.553) Tolerance .781 .982 791 VIF 1.281 1.018 1.264 1999: B 477 -.019** * .0031 0323 167 22 (1.32) (1.82) (.056) (.643) Tolerance .711 882 566 VIF 1.4 1.134 1.502 1999/2000 B 216 .0184* 031 -.0044 176 35 (.85) (2.02) (.76) (.125) Tolerance 685 .911 661 VIF 1.456 1.098 1.5137 (*) indicates significance at all levels (**) indicates significance at .05 level (***) indicates significance at .10 level IMPLICATIONS OF THE STUDY The results of this study have important implications for liquidity management in various Saudi companies. First, it is clear that there is a negative relation between profitability and liquidity indicators such as current ratio and cash gap in the Saudi sample examined. The study also revealed that there is great variation among industries with respect to the significant measure of liquidity. Although certain liquidity levels are desirable and sometimes unavoidable, the study points to the lost profits and the unnecessary costs that are borne by companies as a result ofIJCM Vol. 14, No. 2, 2004 59 holding excessive liquidity. These losses or costs could be reduced or eliminated by adopting active liquidity management strategies. Furthermore, the study highlights and reviews briefly the importance of using the various measures and techniques that contribute towards an efficient management of liquidity and, hence, improve profitability. These techniques include the JIT system, credit insurance, and factoring of receivables, to mention a few. SUMMARY AND CONCLUSIONS This study has attempted to empirically examine the relation between profitability and liquidity in a sample of 29 joint stock companies that represent the major economic sectors in the kingdom (excluding the Electricity and Banking industries) over the period 1996-2000. The study reveals that there exists a significant and negative relation between profitability and liquidity measures such as current ratio and cash gap. The study found that CR is the most important liquidity measure that affects profitability. This effect, however, varies with the level of liquidity as measured by CR. However, within sectors the cash gap, as a liquidity measure, is found to be more important than CR in affecting profitability. Size is also found to bear some influence over profitability within economic sectors, but not in the overall sample. These two influences are more profound in capital- intensive sectors, such as manufacturing and agriculture. Nevertheless, cash gap is found to lose its importance within the labor- intensive sectors, such as services. APPENDIX A The Companies included in the Sample (by Sector) Agricultural: Saudi Fisheries Company National Agricultural Development Company Tabuk Agricultural Development Company (TADCO) Aljouf Agricultural Development Company Jizan Agricultural Development Company (GAZADCO) Hail Agricultural Development Company (HADCO) Qassim Agricultural Development Company (GACO) Ash-Sharqia Agricultural Development Company (SHADCO) Industrial National Gypsum Company Saudi Ceramic Company Arabian Pipes Company Food Products Company Saudi Company for Industrial Development (SIDC) Saudi Pharmaceutical Industries and Medical Application Company (SPIMACO) Saudi Basic Industries Corporation (SABIC) The Saudi Arabia Aminantit Company National Industrialization Company Saudi Cable Company IJCM Vol. 14, No. 2, 2004 60 = Saudi Arabian Fertilizers Company (SAFCO) National Gas and Industrialization Company (GASCO) The Savola GroupLITERATURE REVIEW Working capital represents a safety cushion for providers of short-term funds of the company, and as such they view positively the availability of excessive levels of working capital and cash. However, from an operating point of view, working capital has increasingly been looked at as a restraint on nancial performance, since these assets do not contribute to return on equity (Sanger, 2001). Furthermore, liquidity management is important in good times and it takes further importance in troubled times. The efcient management of the broader measure of liquidity, working capital, and its narrower measure, cash, are both important for a company's protability and well being. In the words of Fraser (1998) "there may be no more nancial discipline that is more important, more misunderstood, and more often overlooked than cash management." However, as argued vividly by Nicholas (1991,) companies usually do not think about improving liquidity management before reaching crisis conditions or becoming on the verge of bankruptcy. Survey of working capital and cash management literature, however, shows that instead of linking liquidity and cash management to a known efciency or protability measures, the majority of research, especially the earlier efforts, attempts to develop models for optimal liquidity and cash balances, given the organization's cash ows. The earlier cash management research focused on using quantitative models that weight the benets and costs of holding cash (liquidity). Under this category falls Baumol's (1952) inventory management model and Miller and Orr's (1966) model which recognizes the dynamics of cash flows. The benet of these earlier models is that they help nancial managers understand the problem of cash management, but they do require assumptions that may not hold in practice. Similarly, Johnson and Aggarwal (1988) support a treasury approach to cash management, which concentrates on flows which entail that cash collection and payment cycles must be broken into their constituent parts. Management then should review the time needed for each link in the collection and payment cycles. Some policy outlines, similar to these, were proposed by Schneider (1938) by arguing that cash management should include analytical review of the procedures followed in managing working capital. These include granting of credit, managing balances, and collecting payments when due. The subsequent and more practical approaches to liquidity management focused on working capital requirements and levels of desired liquidity as measured by current ratio and its variants. The nance textbooks and literature covered the techniques and approaches aimed at managing working capital and its individual components. Again most of these approaches attempt to develop an optimal level of working capital components under certain assumptions, albeit less restrictive than their earlier counterparts used to facilitate development of cash management techniques. Various other techniques have been suggested to improve liquidity and cash positions and to increase the efficiency of their management and in turn protability. These include credit insurance (Brealey and Myers, 1996; Unsworth, 2000; and Raspanti, 2000), factoring of receivables (Brealey and Myers, 1996; Summers and Wilson, 2000). However, as measures of liquidity, both the working capital and liquidity ratios have come under criticism for various reasons. Hawawini et al. (1936), for example, argue that the IJCM Vol. 14. No. 2. 2004 50 concept of working capital requirement is a better measure of a rm's investment in its operating cycle titan the traditional concept of net working capital. Similarly. Finnerty (1993) points out that the traditional liquidity ratios, such as the current ratio or quick ratio, include both liquid nancial assets and operating assets in their formula. Thus. from an ongoing concern point of View. the inclusion of operating assets which are tied up in operations is not useful- Kamath (1939), however, argues that both current and quick ratios are decient due to their static nature and the inadequacy of using them as measures of future cash flows and liquidity. These shortcomings of working capital and liquidity ratios have led researchers and analysts to advocate other measures of liquidity that are more indicative of cash availability. The net cash conversion cycle. or the cash gap has been suggested by many as a possible supplement or replacement to the working capital and current ratios as measures of available liquidity (see Gitman (1974). Richard and Laughlin (1980). Boer (1999), and Genny et al.. (1990). It is generally argued that this approach is more practical due to the dynamic nature of cash cycles and the many complications and tradeoffs involved. Some authors, such as Kamath (1989'). suggest that cash gaps can he used to replace or supplement liquidity ratios (current ratio and quick ratio) in measuring and predicting the nature and pattern of future cash flours. The static current ratios alone fall short of adequately predicting future cash ows. Other studies, such as Kolay (I991), differentiate between short-term and long-term strategies that improve nancial position and cash management policies. The cash gap, known also as cash ow cycle or cash conversion cycle. measures the length of time between actual cash expenditures on productive resources and actual cash receipts from the sale of products or services. Thus, this denition for cash conversion cycle indicates that a shorter cash cycle or gap is desirable since the larger the cash cycle or gap the greater the need for external nancing and the greater the nancing costs to be borne in form of explicit interest costs or implicit costs of other nancing sources, such as equity. The interest cost is more expensive in Saudi Arabia. than in other countries, because of the absence of tax savings (national companies incorporated in Saudi Arabia are not required to pay taxes, they instead pay zakat {level or xed percentage tax required by Islamic sharia). To emphasize the importance of managing liquidity. looser (1938) tapped the extreme in order to reduce the cash cycle. Loeser recommended assessing interest charge at the prime rate to outstanding accounts receivable and unhilled revenue in order to encourage responsible employees and departments within companies to put every effort necessary to collect receivables. and thus reduce cash gaps. This same approach was expressed recently by Fraser {1993) who argues that liquidity and cash gap management starts with a simple task for nancial managers by making certain that their billings. collections, and payables systems are operating efciently. The direct effect of liquidity is not only on the cash position and the troubles it may cause to nancial managers. but it rather effects the company's prots in a more direct way. This direct effect stems hour the need of the company to borrow to nance the working capital requirements and cash gaps. For example, if a company has a cash gap of 190 days, this means that the conipany has to borrow an amount equivalent to 100 times the daily cost of sales. The borrowing cost reduces both pretax and after-tax prots by equal amounts. In Saudi Arabia the feature of borrowing cost as a cheap source of nancing loses its tax advantage since there is no tax on Saudi companies' prots. Likewise. reducing cash gaps by any number of days will add equally to the pretax and alter-tax prots. Shin and Soenen (1998) investigated the relation between the film's net trade cycle and its protability. using a large sample of American firms during 1995-1994. The study found a IJCM Vol. 14, No. 2, 2004 51 strong negative relation between the length of the firm's net trade cycle and various measures of profitability, including market measures, such as stock returns, and operating profits. Similarly, this study attempts to examine the relationship between operating profitability and liquidity measures. Unlike previous studies, an attempt is made here to study the effects of various levels of liquidity, in its broader or narrow sense, on a company's profitability. DATA AND METHODOLOGY Since the aim of this study is to examine the relation between profitability and liquidity, the study makes a set of testable hypotheses. First, this study assumes that there may be a relationship between profitability of the company and its liquidity profile, since the later effects the former in a direct way, as a result of the external financing costs or savings thereof. Due to these elements of costs and cost savings this relationship is most likely be negative. Thus, the first hypothesis of this study can be stated as follows: Hypothesis 1 There is a possible negative relation between liquidity of a company and its profitability. Companies with relatively high levels of liquidity are expected to post low levels of profitability and vise versa. Secondly, profitability, on the other hand, may be a function of the size of companies (measured in terms of sales or total assets). The company size may affect liquidity, cash gaps and, hence, profitability in different ways. On the one hand, large companies may be able to buy inventory in large quantities in order to get quantity discounts. Further, because of their size , large companies may qualify for quantity discounts from suppliers with relatively small inventory levels. On the other hand, large companies may be able to get favorable credit terms from their suppliers in terms of longer credit periods. Moreover, large companies may have more success in their receivables collection efforts relative to small companies. All these factors may push liquidity levels and cash gaps of large companies to levels lower than that of small companies. On the contrary, small companies are usually not able to obtain as much inventory to qualify for quantity discounts as their large counterparts do. Additionally, small companies make efforts to pay within discount periods in order to benefit from cash discounts and to avoid severing their relations with their suppliers. These factors may force small companies to have higher liquidity levels and larger cash gaps. Accordingly, this study states the following hypothesis: Hypothesis 2: A positive relation may exist between the company size and its profitability. This may be due to the ability of large companies to reduce liquidity levels and cash gaps. Third, liquidity and cash gaps may differ among industries and among countries and may depend on the prevailing economic conditions. Sometimes traditions and the nature of business set the typical working capital requirements and the cash gap in a given industry. Some industries have inherently high levels of working capital requirements and large cash gaps than others, while some may require low levels of working capital and shorter or even negative cash gaps, which indicate their ability to obtain cost-free capital from their customers. Hawawini et al. (1986) examined a sample of 1181 American firms from thirty-six industries over a period of nineteen years and found significant and persistent industry effects on a firm's investment in working capital. The ability to operate with low levels of working capital and obtaining cost-freeIJCM Vol. 14, No. 2, 2004 52 capital may have direct positive bearing on profitability. Thus, this study states the following hypothesis: Hypothesis III Need for working capital and liquidity is influenced by the industry in which the company operates. Capital intensive industries require low levels of working capital and tend to have smaller cash gaps than their labor-intensive counterparts. Accordingly, liquidity requirement is expected to have no significant negative impact on profitability of capital - intensive industries, while such effect is expected in labor- intensive ones. To test these hypotheses this study uses the following methodology: 1. The study first estimates the cash gap for each company and for each year of the sample period as follows: Cash Gap = Days in Inventory (DII) + Days in Accounts Receivable (DIR) - Days in Accounts Payable (DIP) The components of the cash gap are calculated as follows: Inventory turnover = cost of goods sold/ average inventory Number of days in inventory= 365/ inventory turnover Number of days in Receivables= Receivables/ average daily sales Number of days in Payables = Payables / average daily purchases 2. Correlation analysis to identify the association between profitability and liquidity indicators and other related variables 3. Regression analysis to estimate the causal relationship between profitability variable, liquidity and other chosen variables The data for this study comes from a sample of Saudi joint stock companies. Overall, 29 joint stock companies that are publicly traded and provide annual audited financial reports are selected. This sample encompasses three basic Saudi economic sectors. Table 1 shows the sample by sector over the period 1996-2000. However, due to unavailability of data in some of the years for some companies and sectors, the distribution of the sample is not homogenous over the sample period. TABLE 1 Sample Distribution and Description Economic Sector 1996 1997 1998 1999 2000 Agriculture 5 7 7 6 5 Industrial 11 10 12 8 8 Services 5 7 8 8 Total 21 24 27 22 13 The sample does not include electricity and banking sector companies. The former is regulated and has undergone major structural changes during the sample period, while the banking sector activity does not fit the issues at hand. It should be mentioned that some problems are encountered in collecting the data for this study. First, most cement companies in the Kingdom do not disclose sales revenue. Second, most companies do not report the purchases figure or detailed cost of goods sold figures. Thus, the sample is restricted to those companiesIJCM Vol. 14, No. 2, 2004 53 for which purchases figure can be calculated and the sales figures are available. Both components are necessary to calculate cash gaps. Nevertheless, the total sample represents about 50 percent of the total number of Saudi publicly held companies (excluding Banking and electricity companies). Thus, the final sample includes the most important joint stock companies in Saudi Arabia (See Appendix A to this study for a list of the companies included in the sample). RESULTS AND ANALYSIS The following notations are used throughout this study: S= net sales TA= Total assets CG=Cash gap in days CR=Current ratio LOGS= Logarithm of net sales LOGTA= Logarithm of total assets CGS= Cash gap in days/100 NOI= Net operating income + depreciation / net sales Table 2 shows the measures of central tendency and dispersion for the basic variables used in this study; NOI, CR, CG, and S. The table shows wide variation for these variables, especially Sales (S) and Cash gap (CG). Thus these two variables are transformed in the analysis that follows, by taking the logarithm of sales (to satisfy normality) and divide CG by 100, to get a new scaled variable CGS. TABLE 2 Descriptive Statistics (n =107) S(mills) CG (days) CR NOI Mean 2882.08 180 2.835 . 1936 Std Dev. 20336 184 5.22 .256 Minimum 7.9 -592 .4 -.55 Maximum 208333.2 948 34.1 1.29 Q1 107.6 88 1.1 078 Q3 350.0 247 2.1 .326 The study first examines the relationship that exists between the variables of profitability and liquidity. Table 3 shows the Pearson correlation coefficients between NOI, CGS, LOGTA, LOGS, CR, CG, and TA for the whole sample of 107 company-year observations.IJCM Vol. 14, No. 2, 2004 54 TABLE 3 Pearson Correlation Coefficients Matrix TA CG CR LOGS LOGTA| CGS NOI S 571* -.071 -.026 507* 430 .071 -.041 (.00) (.465) (.791) (000) (000) (.465) (.673) TA 1.00 -.101 -.057 655* .723* -.101 .08 (.30) (.561) (.00) (.00) (.30) (.411) CG 1.00 .001 -.036 -.085 1.00* -. 124 (.00 .99 (.71) (.385) 6.00 (.20) CR 1.00 -.388* -.217** 001 -.379* (.00) (.00) (.025) (.99 6.00 LOGS 1.00 -.868* -.036 .205* * (.00) (.00) (.71) (.034) LOGTA 1.00 -.085 .262* (.385 (.006) CGS 1.00 -.124 (.00) (.202) * indicates significance at all levels **indicates significance at .05 level If efficient liquidity management increases profitability, one should expect a negative relationship between the measures of liquidity and profitability variable. In Table 3 the correlation coefficients indicate a significant negative relationship between current ratio (CR) and Net Operating Income (NOD). However, the relationship between NOI and Cash Gap (CG/CGS) is negative, but is not statistically significant. These results indicate that these two variables (CR and CG) measure liquidity differently. One should not overlook the positive significant association that exists between NOI and the two measures of size, LOGS and LOGTA, which in turn indicates a positive relation between size and profitability. This has to be viewed in light of the highly significant negative correlation that exists between these two variables and the CR. Similarly, a negative relation exists between LOGS and LOGTA and CG, but is not significant. Finally, one should observe the strong highly positive relation that exists between sales and total assets which show that they are substitute measures of size. To investigate the association between profitability and liquidity further, the study estimates the following regression equation for the whole sample and for four sub- samples. The sub-samples are by products of dividing the sample into four sub- samples, based on CR and CG. The first two sub- samples are created by dividing the sample into two sub- samples, one with CR 2 and the other with CR>2. The reason for this split is to examine whether the effect on profitability is a function of the level of liquidity. The other two samples are created by dividing the sample into two sub- samples, one with CG 150 days. The purpose in this case is to examine whether the relation between profitability, liquidity levelIJCM Vol. 14, No. 2, 2004 55 and cash gap is a function of the efficiency of managing cash cycle. For the sample and each of the sub- samples the following regression equation is estimated: NOI= Bo+B, CR+B2CGS+B3LOGS+e Where: Bo. B1, B2 B3, the coefficients of the regression equation; and the other variables are as defined before. TABLE 4 NOI= Bo+B, CR+B2CGS+BLOGSte Regression (1): The general regressions Intercept CR CGS LOGS R F N Pooled B 2.18 ** -.017* .-.017 010 .163 6.66* 107 (2.2) (3.63) (1.35) (.639) Tolerance 849 998 .848 VIF 1.178 1.002 1.179 Sub- sample CR 2 B -.192 -.009* -.034 -.059* .486 9.76* 35 (1.36) (2.21) (1.57) (2.44) Tolerance 653 .999 .654 VIF 1.531 1.00 1.53 Sub- sample CG150 B 198 -.018* -.005 -.0076 .182 4.28* 62 Tolerance (1.08) (2.684) (.225) (.241) VIF 644 .961 .643 1.553 1.04 1.556 VIF= Variance Inflation Factor. (*) indicates significance at all levels