

Question: list excel formulas thank you Colate control for the chart standard deviations corresponding to this problem $ Conditional Problem 2) For the volume of the
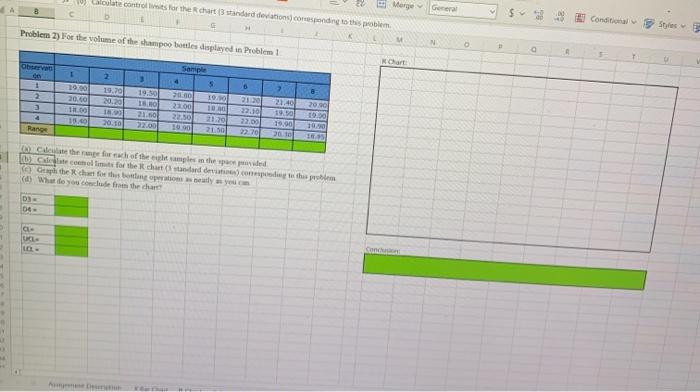
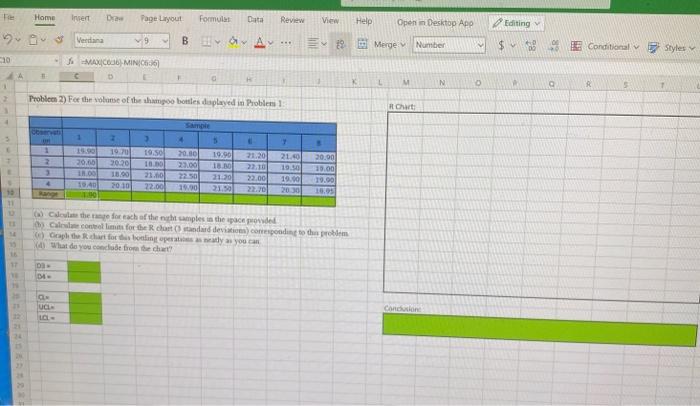
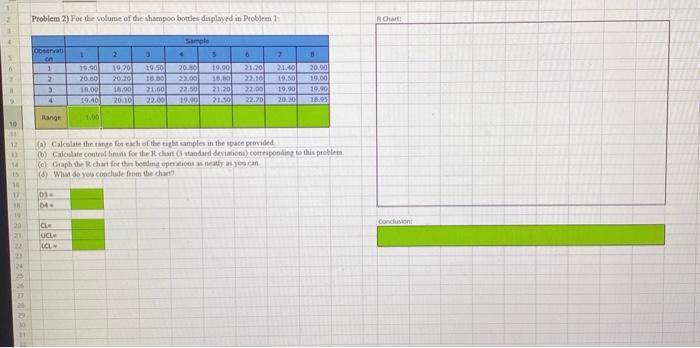
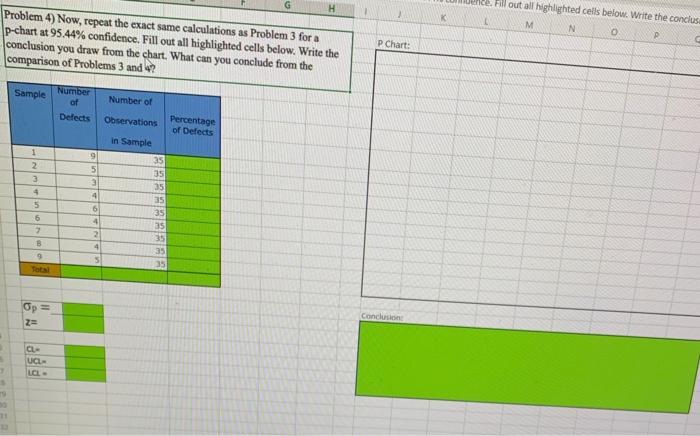
Colate control for the chart standard deviations corresponding to this problem $ Conditional Problem 2) For the volume of the shampoo bottles displayed in Problem 1 N Kart Sample 3 1 2 19.00 2000 11.00 2 19.79 20.20 19 19.50 18 21.00 22.00 2010 2100 22.50 2000 6 2120 22.10 22.00 22.70 21.40 1950 4 Range 20.10 19. 19.00 19.90 19 21.50 2010 Cether forech of the samples in the speeded DIG for the charts and conduce this problem the chart for them D- 06- UL. Home Insert Da Page Layout Formular Review View Help Open in Desktop App Editing BIYA... Merge Number $ Conditional Styles MAXIC6) MIN 3 1 o L M N . R 5 Problem 2) Fee the one of the champoo bottles daplayed in Problem 1 Chart 3 1 4 B 19.90 21.20 20.00 LH 09 | 3 19.20 2020 18.00 20.10 19.50 10.00 23.00 22.00 7 21.00 19.30 19.00 20:30 20.30 23.00 22 50 19.00 21.30 21.50 22.00 22.01 20.90 19.00 19.00 10.05 10 11 1:00 c) Calculate for each of the night samples is the cene Cales con las for the chantandard devic) consponding to this problem Graph the chart for boling operasy as you can What do you can lade from the cha 11 04 UCH Conclusione Problem 2) For the volume of the shampoo bottles desplayed in Problem Chat Observati 3 4 1 6 1 2 3 4 1 19.90 20.60 11.00 19.40 19.20 20.30 15.00 20.10 19.50 18.50 21.00 22.001 20.30 23.00 22.50 19.00 16.00 21.20 21250 21:20 22.10 22.00 22.70 2 21.40 19.50 19,90 20.30 8 20.00 19.00 10.00 18.05 Range 10 12 () Calculate the age for each of the night samples in the puce provided b) Calculate control for the chart standard deviation complete this problem (c) Graph the chart for this boudin apostly as you can (6) Wudo y conclude the chart 1 1 01- 04- 1 30 Concho CL UCL CL 24 27 G H Fill out all highlighted cells below. write the conclus M N O Problem 4) Now, repeat the exact same calculations as Problem 3 for a p-chart at 95.44% confidence. Fill out all highlighted cells below. Write the conclusion you draw from the chart. What can you conclude from the comparison of Problems 3 and 4? P Chart: Sample Number of Detects Number of Observations Percentage of Defects 1 2 3 4 5 6 9 5 3 4 in Sample 35 35 35 35 35 35 35 35 35 6 4 2 B 9 5 Op = Z= Conclusion CLE UCL- LOL 18 13 Colate control for the chart standard deviations corresponding to this problem $ Conditional Problem 2) For the volume of the shampoo bottles displayed in Problem 1 N Kart Sample 3 1 2 19.00 2000 11.00 2 19.79 20.20 19 19.50 18 21.00 22.00 2010 2100 22.50 2000 6 2120 22.10 22.00 22.70 21.40 1950 4 Range 20.10 19. 19.00 19.90 19 21.50 2010 Cether forech of the samples in the speeded DIG for the charts and conduce this problem the chart for them D- 06- UL. Home Insert Da Page Layout Formular Review View Help Open in Desktop App Editing BIYA... Merge Number $ Conditional Styles MAXIC6) MIN 3 1 o L M N . R 5 Problem 2) Fee the one of the champoo bottles daplayed in Problem 1 Chart 3 1 4 B 19.90 21.20 20.00 LH 09 | 3 19.20 2020 18.00 20.10 19.50 10.00 23.00 22.00 7 21.00 19.30 19.00 20:30 20.30 23.00 22 50 19.00 21.30 21.50 22.00 22.01 20.90 19.00 19.00 10.05 10 11 1:00 c) Calculate for each of the night samples is the cene Cales con las for the chantandard devic) consponding to this problem Graph the chart for boling operasy as you can What do you can lade from the cha 11 04 UCH Conclusione Problem 2) For the volume of the shampoo bottles desplayed in Problem Chat Observati 3 4 1 6 1 2 3 4 1 19.90 20.60 11.00 19.40 19.20 20.30 15.00 20.10 19.50 18.50 21.00 22.001 20.30 23.00 22.50 19.00 16.00 21.20 21250 21:20 22.10 22.00 22.70 2 21.40 19.50 19,90 20.30 8 20.00 19.00 10.00 18.05 Range 10 12 () Calculate the age for each of the night samples in the puce provided b) Calculate control for the chart standard deviation complete this problem (c) Graph the chart for this boudin apostly as you can (6) Wudo y conclude the chart 1 1 01- 04- 1 30 Concho CL UCL CL 24 27 G H Fill out all highlighted cells below. write the conclus M N O Problem 4) Now, repeat the exact same calculations as Problem 3 for a p-chart at 95.44% confidence. Fill out all highlighted cells below. Write the conclusion you draw from the chart. What can you conclude from the comparison of Problems 3 and 4? P Chart: Sample Number of Detects Number of Observations Percentage of Defects 1 2 3 4 5 6 9 5 3 4 in Sample 35 35 35 35 35 35 35 35 35 6 4 2 B 9 5 Op = Z= Conclusion CLE UCL- LOL 18 13
Step by Step Solution
There are 3 Steps involved in it

Get step-by-step solutions from verified subject matter experts