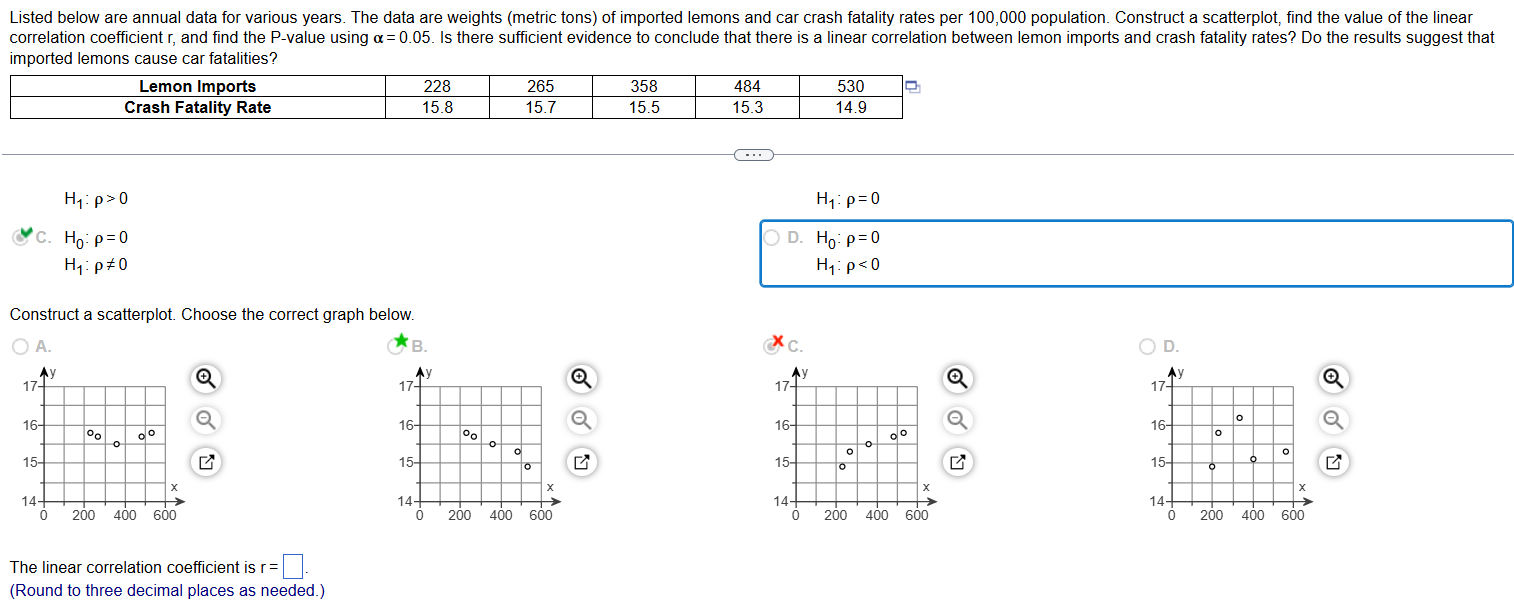
Question: Listed below are annual data for various years. The data are weights (metric tons) of imported lemons and car crash fatality rates per 100,000 population.

Listed below are annual data for various years.
Listed below are annual data for various years. The data are weights (metric tons) of imported lemons and car crash fatality rates per 100,000 population. Construct a scatterplot, find the value of the linear correlation coefficient r, and find the P-value using 0 H1 : p = 0 YC. Ho: P = 0 OD. Ho: P =0 Hy : p #0 Hy : p = 0 Construct a scatterplot. Choose the correct graph below. O A. *B. X C. O D. 17 Ay 17- 17- Ay 17 16- 16- 16- 16- o o o 15- 15 O to 15- o to 15. X 14 X X 14+ X 200 400 14- 600 0 200 400 600 14- 0 200 400 600 0 200 400 600 The linear correlation coefficient is r=. (Round to three decimal places as needed.)

Step by Step Solution

There are 3 Steps involved in it

1 Expert Approved Answer
Step: 1 Unlock blur-text-image
Question Has Been Solved by an Expert!

Get step-by-step solutions from verified subject matter experts

Step: 2 Unlock
Step: 3 Unlock

Students Have Also Explored These Related Accounting Questions!