

Question: Listed below are the comparative balance sheets for the current year (20X2) and for the prior year (20x1) of Johnson Corporation. 12/31/20x2 12/31/20X1 Cash Accounts
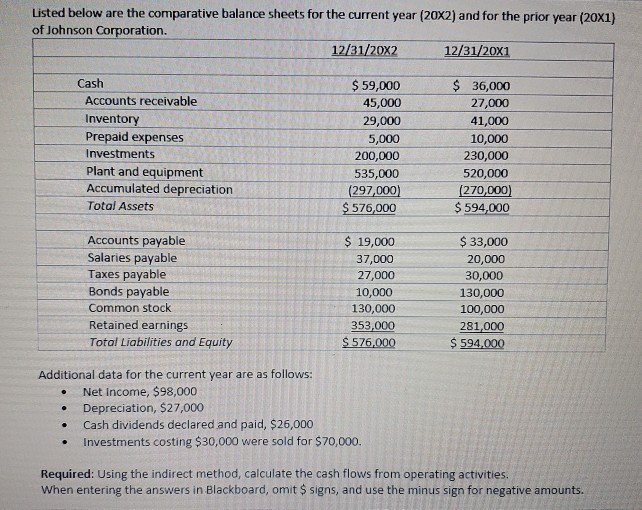
Listed below are the comparative balance sheets for the current year (20X2) and for the prior year (20x1) of Johnson Corporation. 12/31/20x2 12/31/20X1 Cash Accounts receivable Inventory Prepaid expenses Investments Plant and equipment Accumulated depreciation Total Assets $ 59,000 45,000 29,000 5,000 200,000 535,000 (297,000) $ 576,000 27,000 41,000 10,000 230,000 520,000 (270,000) $ 594,000 Accounts payable Salaries payable Taxes payable Bonds payable Common stock Retained earnings Total Liabilities and Equity $ 19,000 37,000 27,000 10,000 130,000 353,000 $ 576,000 $ 33,000 20,000 30,000 130,000 100,000 281,000 $ 594,000 Additional data for the current year are as follows: Net Income, $98,000 Depreciation, $27,000 Cash dividends declared and paid, $26,000 Investments costing $30,000 were sold for $70,000. Required: Using the indirect method, calculate the cash flows from operating activities When entering the answers in Blackboard, omit $ signs, and use the minus sign for negative amounts
Step by Step Solution
There are 3 Steps involved in it

Get step-by-step solutions from verified subject matter experts