

Question: Listen Match the estimated pleasantness value based on the information in Figure lowest woman who is odoor p 2 NOT taking the P-0.01 contraceptive pill
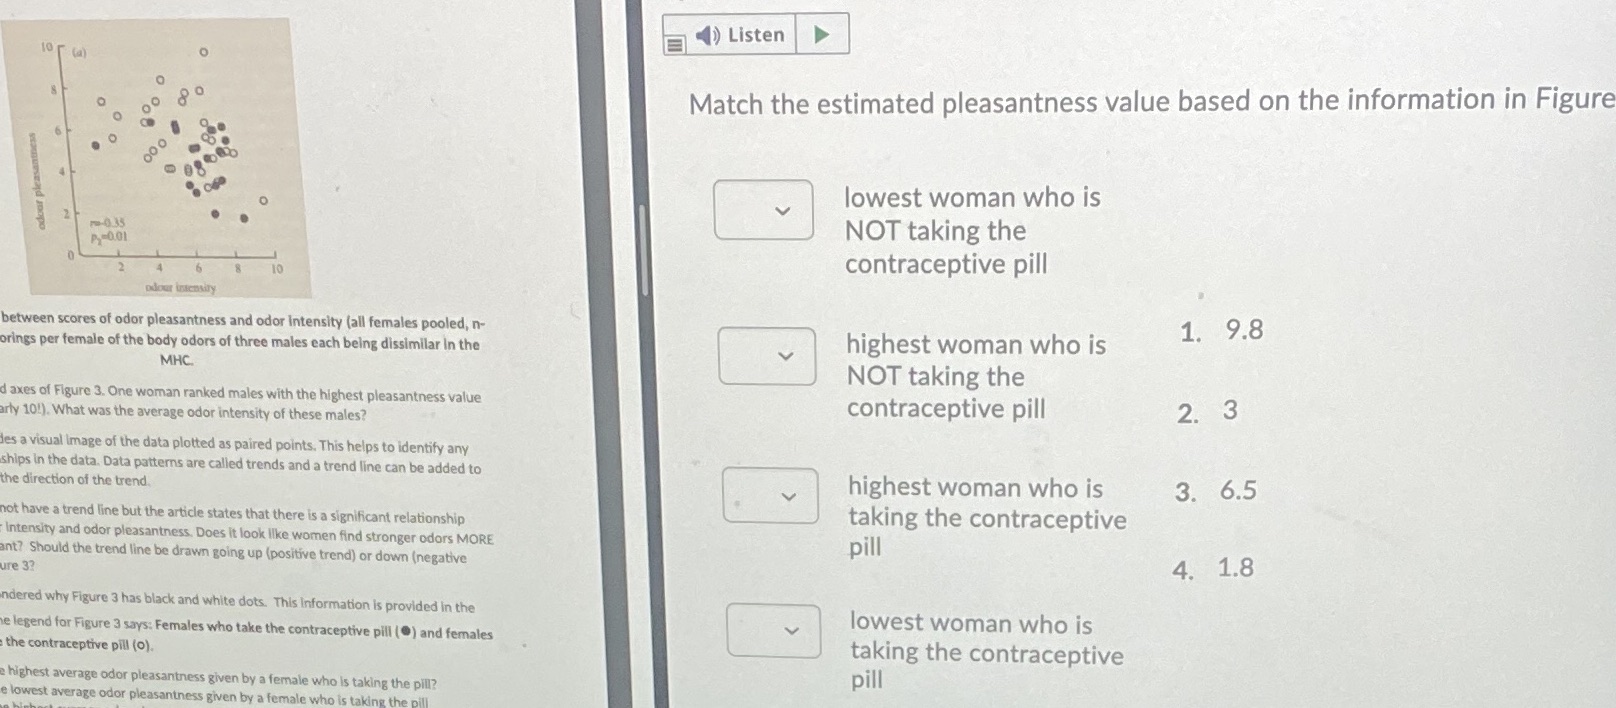
Listen Match the estimated pleasantness value based on the information in Figure lowest woman who is odoor p 2 NOT taking the P-0.01 contraceptive pill between scores of odor pleasantness and odor Intensity (all females pooled, n- 1. 9.8 orings per female of the body odors of three males each being dissimilar In the highest woman who is MHC. NOT taking the d axes of Figure 3. One woman ranked males with the highest pleasantness value arly 10!). What was the average odor intensity of these males? contraceptive pill 2. 3 es a visual Image of the data plotted as paired points. This helps to identify any ships in the data. Data patterns are called trends and a trend line can be added to the direction of the trend. highest woman who is 3. 6.5 not have a trend line but the article states that there is a significant relationship taking the contraceptive Intensity and odor pleasantness. Does it look like women find stronger odors MORE ant? Should the trend line be drawn going up (positive trend) or down (negative pill ure 3? 4. 1.8 ndered why Figure 3 has black and white dots. This Information is provided in the e legend for Figure 3 says: Females who take the contraceptive pill () and females lowest woman who is the contraceptive pill (o). taking the contraceptive highest average odor pleasantness given by a female who is taking the pill? pill e lowest average odor pleasantness given by a female who is taking the pill
Step by Step Solution
There are 3 Steps involved in it

Get step-by-step solutions from verified subject matter experts