

Question: Locate the Financial Leverage Graphs document in the Files section of the bCourses site. You can print out this page and answer the question on
- Locate the Financial Leverage Graphs document in the Files section of the bCourses site. You can print out this page and answer the question on that page. If you do not have a printer, then reproduce that page on a sheet of paper.
Show graphically and explain what will happen to the graphs if common shareholders become more risk averse. (12 points).
- This question focuses on debt, preferred stock, common stock and retained earnings. Make sure that you provide a complete explanation regarding common stock compared to retained earnings.
If we construct a graph that has the cost of capital on the vertical axis and the risk ofthe firm on the horizontal axis, what does the graph look like? Explain. (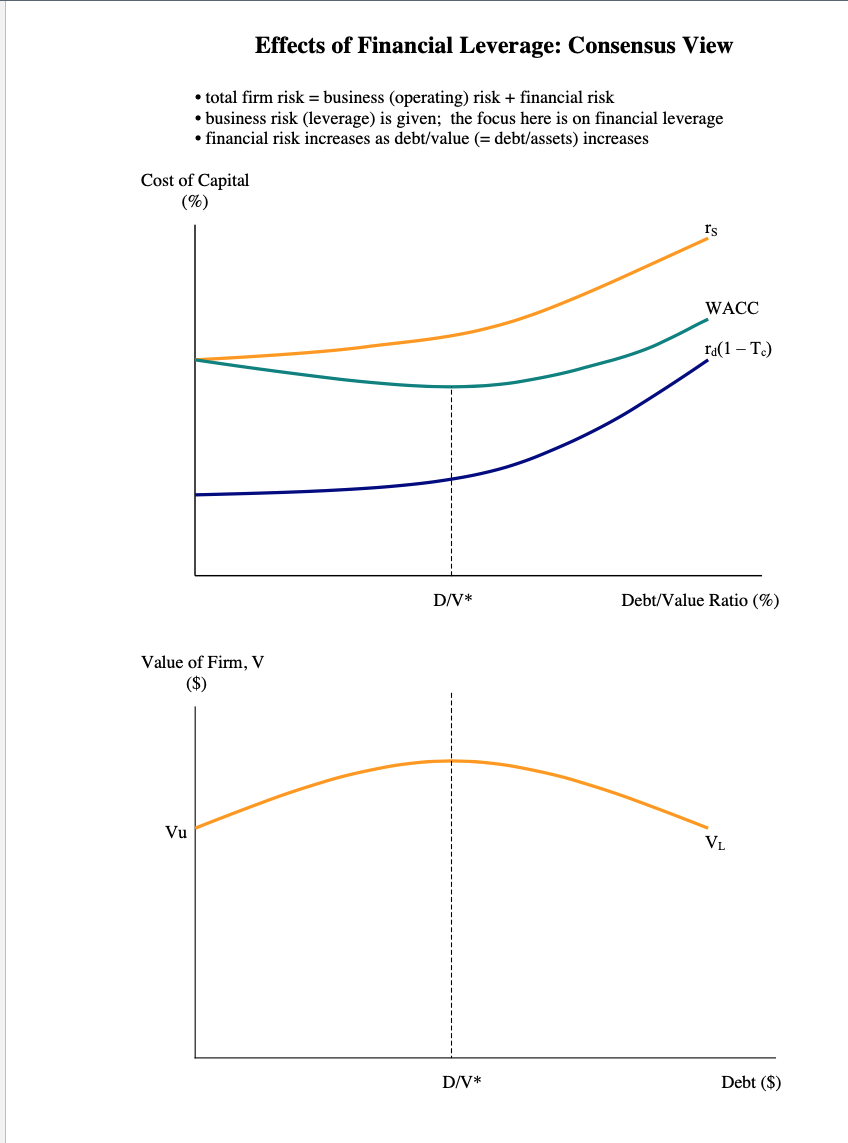
Effects of Financial Leverage: Consensus View total firm risk = business (operating) risk + financial risk business risk (leverage) is given; the focus here is on financial leverage financial risk increases as debt/value (= debt/assets) increases Cost of Capital (%) rs WACC ra(1 T.) D/V* Debt/Value Ratio (%) Value of Firm, V ($) Vu VL D/V* Debt ($) Effects of Financial Leverage: Consensus View total firm risk = business (operating) risk + financial risk business risk (leverage) is given; the focus here is on financial leverage financial risk increases as debt/value (= debt/assets) increases Cost of Capital (%) rs WACC ra(1 T.) D/V* Debt/Value Ratio (%) Value of Firm, V ($) Vu VL D/V* Debt ($)
Step by Step Solution
There are 3 Steps involved in it

Get step-by-step solutions from verified subject matter experts