

Question: log probability graph paper Linear probability graph paper Thank you so much for your help!!! Table 1. Particle size analysis of milled lactose using a

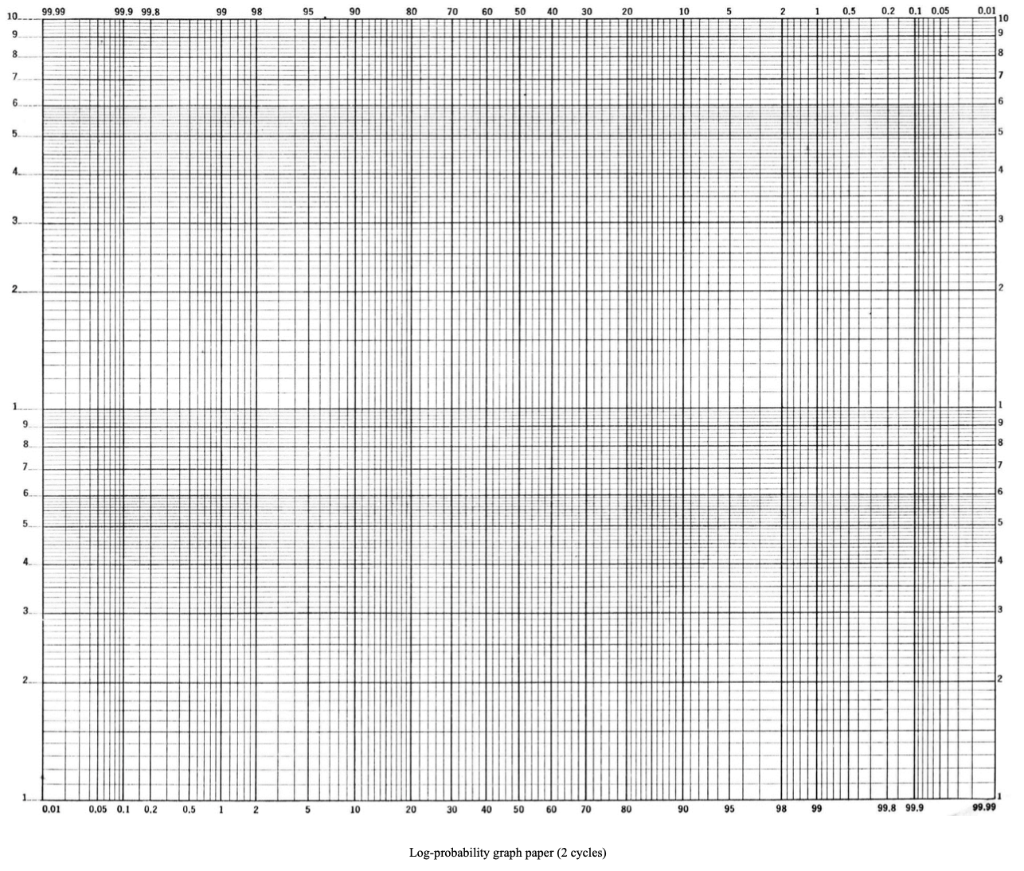
log probability graph paper
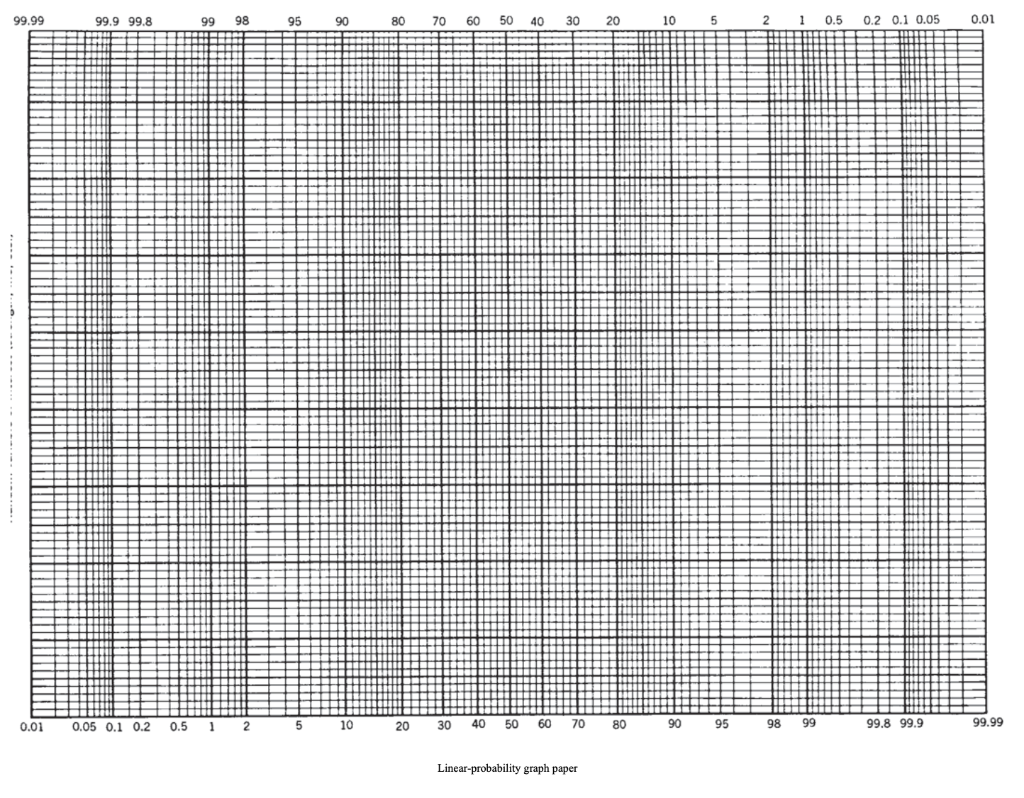
Linear probability graph paper
Thank you so much for your help!!!
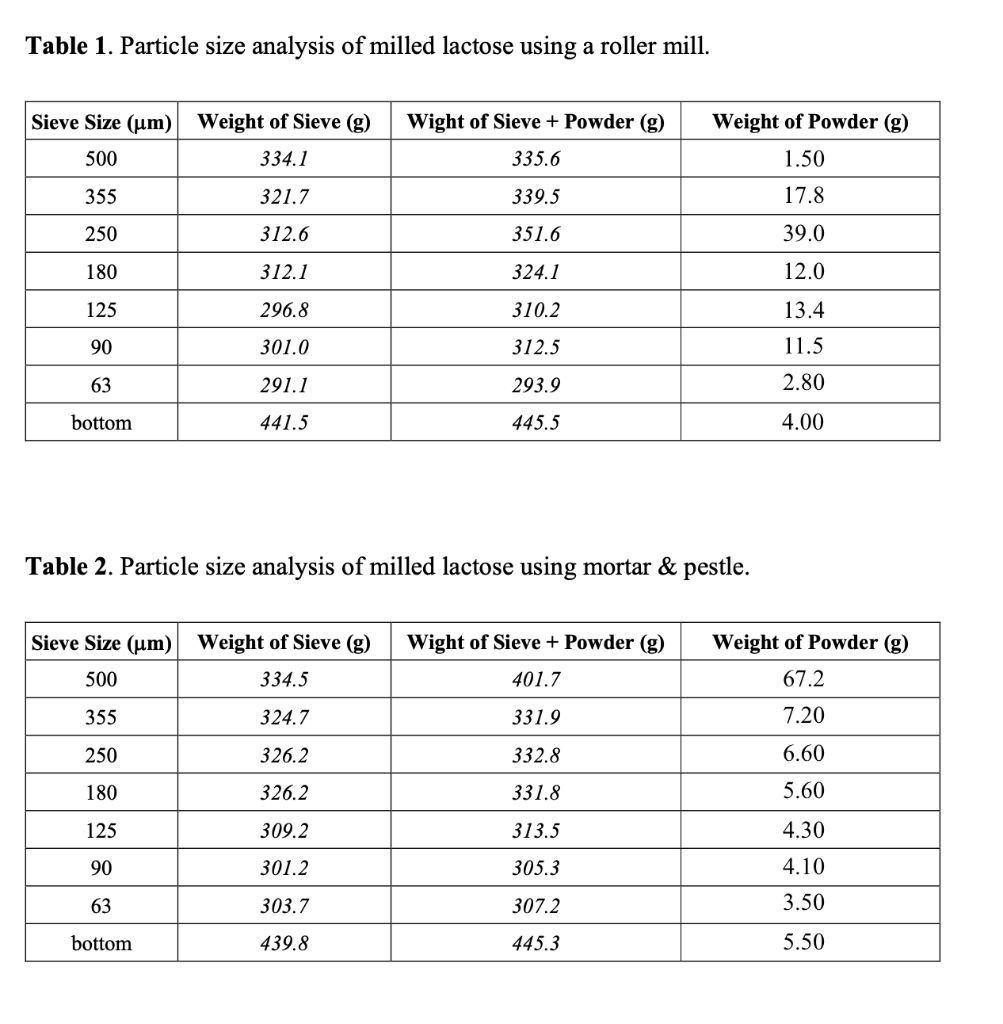
Table 1. Particle size analysis of milled lactose using a roller mill. Wight of Sieve + Powder (g) Weight of Powder (g) Sieve Size (um) Weight of Sieve (g) 500 334.1 335.6 1.50 355 321.7 339.5 17.8 250 312.6 351.6 39.0 180 312.1 324.1 12.0 125 296.8 310.2 13.4 90 301.0 312.5 11.5 63 291.1 293.9 2.80 bottom 441.5 445.5 4.00 Table 2. Particle size analysis of milled lactose using mortar & pestle. Sieve Size (um) Weight of Sieve (g) 500 334.5 Wight of Sieve + Powder (g) 401.7 Weight of Powder (g) 67.2 355 324.7 331.9 7.20 250 326.2 332.8 6.60 180 326.2 331.8 5.60 125 309.2 313.5 4.30 4.10 90 301.2 305.3 63 303.7 307.2 3.50 bottom 439.8 445.3 5.50 3. Plot the cumulative % undersize against sieve aperture after size reduction of lactose using mortar & pestle, on both linear and log probability paper. 99.99 99 99.9 99.8 98 95 90 80 70 60 50 40 10 30 20 10 5 2 10.5 0.2 0.1 0.05 0.01 10 9 9 8 8 7 7 6 6 5 5 4 4 3 3 2 1 9 8 8 7 6 16 5 5 4 3 13 2 1 0.01 0.05 0.1 0.2 0.5 1 2 2 5 10 20 30 40 50 60 70 80 90 95 98 99 99.8 99.9 99.99 Log-probability graph paper (2 cycles) 99.99 99.9 99.8 99 98 90 80 70 60 50 40 30 20 105 2 1 0.5 0.2 0.1 0.05 0.01 0.01 0.05 0.1 0.2 0.5 1 2 5 10 20 30 40 50 60 70 80 90 95 98 99 99.8 99.9 99.99 Linear-probability graph paper Table 1. Particle size analysis of milled lactose using a roller mill. Wight of Sieve + Powder (g) Weight of Powder (g) Sieve Size (um) Weight of Sieve (g) 500 334.1 335.6 1.50 355 321.7 339.5 17.8 250 312.6 351.6 39.0 180 312.1 324.1 12.0 125 296.8 310.2 13.4 90 301.0 312.5 11.5 63 291.1 293.9 2.80 bottom 441.5 445.5 4.00 Table 2. Particle size analysis of milled lactose using mortar & pestle. Sieve Size (um) Weight of Sieve (g) 500 334.5 Wight of Sieve + Powder (g) 401.7 Weight of Powder (g) 67.2 355 324.7 331.9 7.20 250 326.2 332.8 6.60 180 326.2 331.8 5.60 125 309.2 313.5 4.30 4.10 90 301.2 305.3 63 303.7 307.2 3.50 bottom 439.8 445.3 5.50 3. Plot the cumulative % undersize against sieve aperture after size reduction of lactose using mortar & pestle, on both linear and log probability paper. 99.99 99 99.9 99.8 98 95 90 80 70 60 50 40 10 30 20 10 5 2 10.5 0.2 0.1 0.05 0.01 10 9 9 8 8 7 7 6 6 5 5 4 4 3 3 2 1 9 8 8 7 6 16 5 5 4 3 13 2 1 0.01 0.05 0.1 0.2 0.5 1 2 2 5 10 20 30 40 50 60 70 80 90 95 98 99 99.8 99.9 99.99 Log-probability graph paper (2 cycles) 99.99 99.9 99.8 99 98 90 80 70 60 50 40 30 20 105 2 1 0.5 0.2 0.1 0.05 0.01 0.01 0.05 0.1 0.2 0.5 1 2 5 10 20 30 40 50 60 70 80 90 95 98 99 99.8 99.9 99.99 Linear-probability graph paper
Step by Step Solution
There are 3 Steps involved in it

Get step-by-step solutions from verified subject matter experts