

Question: LOGS 6648 - BPI Assignment #8 - Control Charts Instructions: You need to work as an individual for this assignment. You will turn in your
LOGS 6648 - BPI
Assignment #8 - Control Charts
Instructions:
You need to work as an individual for this assignment. You will turn in your completed Excel spreadsheet to GaView by the due time as the syllabus requires. There is an Excel file with this assignment to make your life a little easier.
Purpose:
This assignment is designed to practice the use of control charts and to use Excel to calculate them (i.e., learn how to make your life easier)!
Requirements:
It is due as identified on the syllabus. NO LATE WORK. Upload the Excel spreadsheet and answer all the questions below on the individual worksheets. When you are done, you should have six worksheets (one for all the colors at once and one each for the five colors!!)
Control Chart Data
You are given a box of 1,000 beads. Samples were drawn in such a manner to assure that they were random. Each bead in the box had the same chance of being included in a sample as every other bead. The purpose was to produce data that would simulate the output of stable process.In other words, no assignable causes would be present.
Most of the beads in the box were of a natural color (tan), but some beads were one of the five other colors: red, white, brown, blue and yellow. Samples of 100 beads were drawn. As each sample was drawn, the number of beads were counted and recorded.
Using the data in the table "Bead Sample" on the next page, prepare a percent defective chart (p-chart) in which any colored bead is considered to be a defective piece (i.e., total all the non-tan beads - the five colors together.)
Next, construct p-charts for the individual colored beads with one per worksheet. Visually compare them with the p-chart you constructed above based on all the colors combined.
See next page for data set.
Control Chart Data - Bead Samples - Assignment #8
| Sample # | Red | White | Brown | Blue | Yellow |
| 1 | 14 | 10 | 5 | 1 | 0 |
| 2 | 16 | 7 | 5 | 0 | 1 |
| 3 | 13 | 10 | 2 | 2 | 0 |
| 4 | 12 | 6 | 5 | 1 | 0 |
| 5 | 12 | 10 | 9 | 5 | 0 |
| 6 | 11 | 6 | 4 | 0 | 2 |
| 7 | 17 | 6 | 3 | 0 | 0 |
| 8 | 20 | 12 | 1 | 1 | 0 |
| 9 | 11 | 6 | 5 | 1 | 1 |
| 10 | 9 | 10 | 7 | 0 | 0 |
| 11 | 6 | 7 | 7 | 2 | 0 |
| 12 | 8 | 6 | 8 | 3 | 0 |
| 13 | 21 | 6 | 3 | 3 | 0 |
| 14 | 17 | 7 | 3 | 3 | 0 |
| 15 | 15 | 11 | 2 | 3 | 0 |
| 16 | 10 | 10 | 4 | 2 | 0 |
| 17 | 9 | 9 | 3 | 3 | 0 |
| 18 | 17 | 5 | 2 | 3 | 1 |
| 19 | 12 | 11 | 2 | 1 | 0 |
| 20 | 14 | 7 | 5 | 4 | 0 |
For each of the p-charts (six total), put your chart on a separate worksheet in Excel. Also, answer this question for each: Is the total or specific color bead's process in or out of control? Why? (what rule did it break - type answer on the worksheet) Finally, make sure your p-bar, UCL and LCL are clear in your chart.
Turn in your completed Excel file to GaView. Note: I have also provided an Excel file with the dataset to keep you from having to retype it.
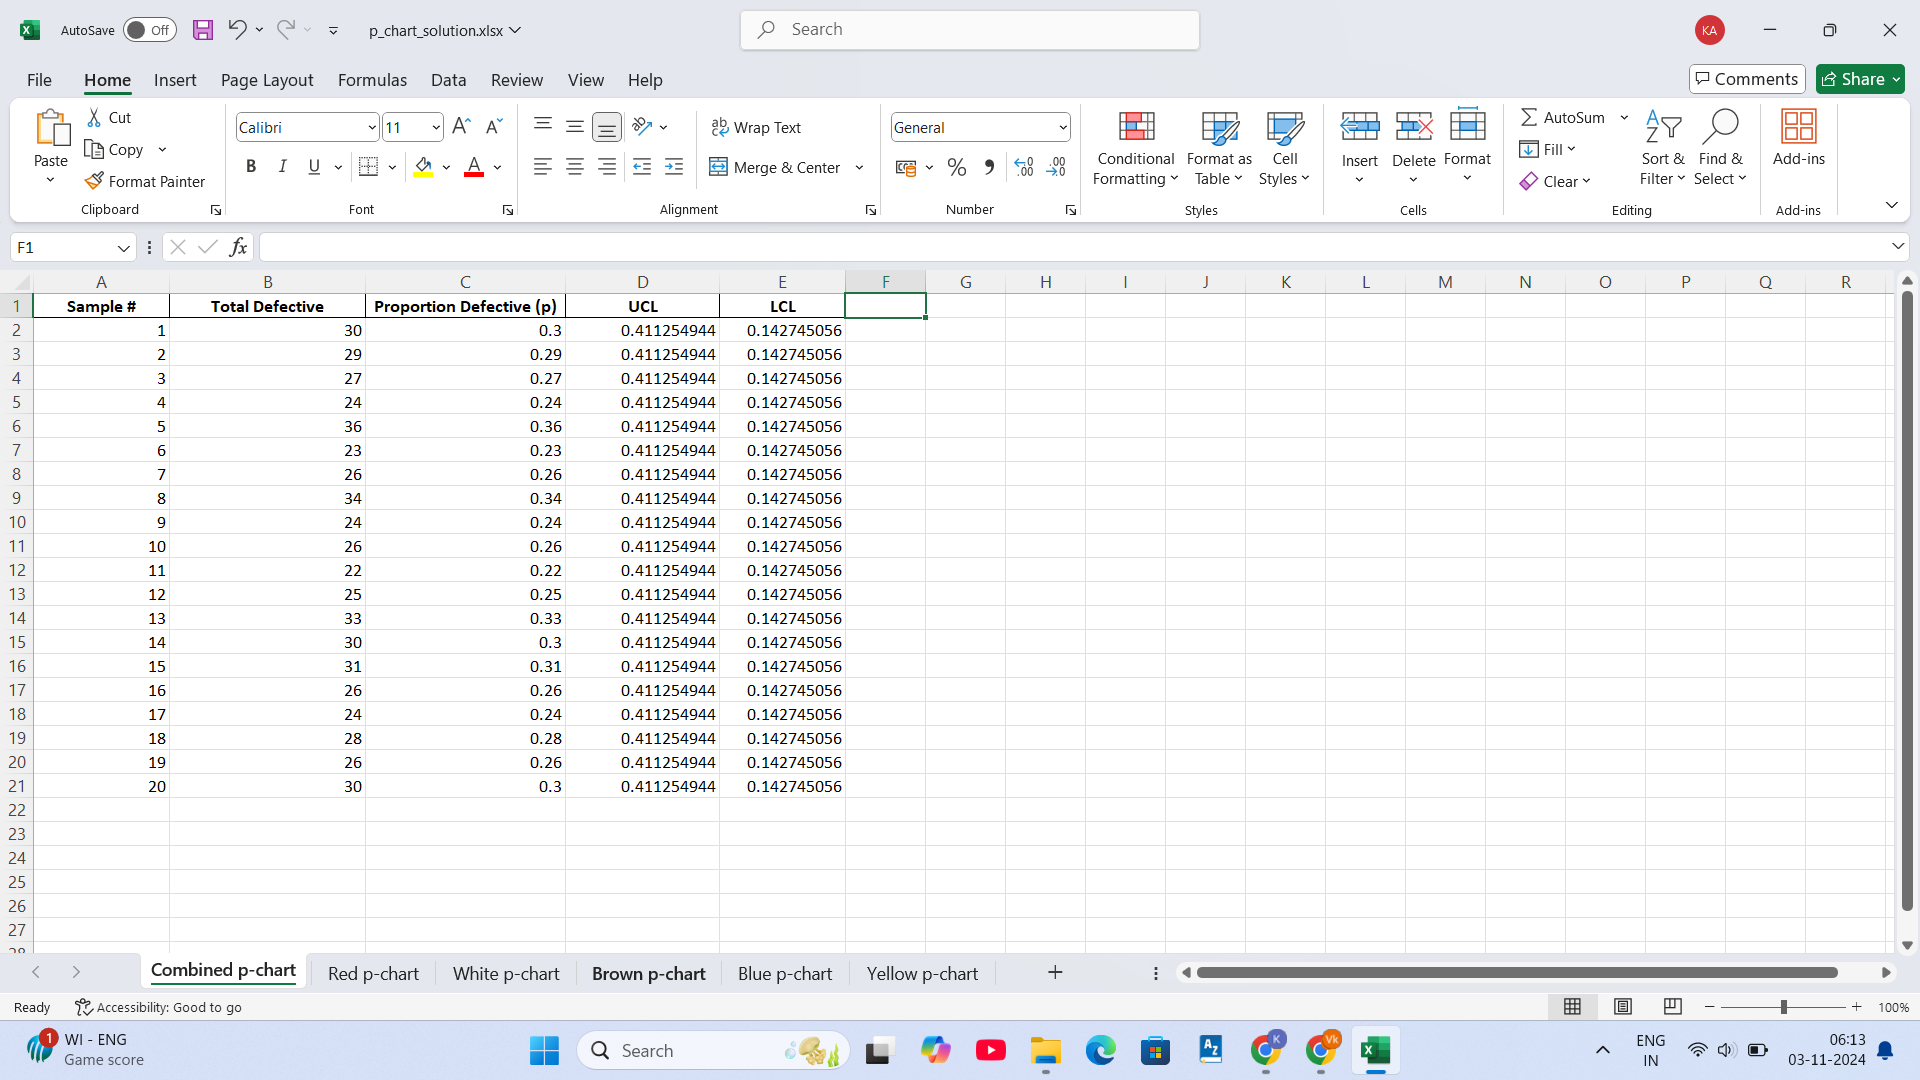 X AutoSave Off H v . p_chart_solution.xlsx Search X File Home Insert Page Layout Formulas Data Review View Help Comments Share ~ X Cut Calibri * 1 1 ~ A " A = = e Wrap Text General AutoSum AY O 88 Copy Paste BIUVFDAY Merge & Center ~ % " .0 Conditional Format as Cell Fill Insert Delete Format Sort & Find & Add-ins 00 Format Painter Formatting Table Styles Clear Filter Select Clipboard Font Alignment Number Styles Cells Editing Add-ins F1 viXVfx A B C D E G H K L M N O P Q R Sample # Total Defective Proportion Defective (p) UCL LCL 30 0.3 0.411254944 0.142745056 1 AWN - 29 0.29 0.411254944 0.142745056 27 0.27 0.411254944 0.142745056 24 0.24 0.411254944 0.142745056 36 0.36 0.411254944 0.142745056 23 .23 .411254944 0.142745056 26 0.26 0.411254944 0.142745056 34 0.34 0.411254944 0.142745056 24 0.24 0.411254944 0.142745056 26 0.26 0.411254944 0.142745056 22 0.22 0.411254944 0.142745056 25 0.25 0.411254944 0.142745056 33 .33 0.411254944 0.142745056 30 0.3 0.411254944 0.142745056 31 0.31 0.411254944 0.142745056 26 0.26 0.411254944 0.142745056 24 0.24 0.411254944 0.142745056 18 28 0.28 0.411254944 0.142745056 19 26 0.26 0.411254944 0.142745056 21 20 30 0.3 0.411254944 0.142745056 22 23 24 25 26 27 Combined p-chart Red p-chart White p-chart Brown p-chart Blue p-chart Yellow p-chart + Ready 2 Accessibility: Good to go + 100% 1 WI - ENG Q Search CK ENG 06:13 Game score IN 03-11-2024
 Step by Step Solution
There are 3 Steps involved in it

Get step-by-step solutions from verified subject matter experts