

Question: Long solow model question 1. Consider a Solow model in which Y = A.KL K+1-(1-2); +1 I=S S=Y C = (1 - 3) L+1-(1 +
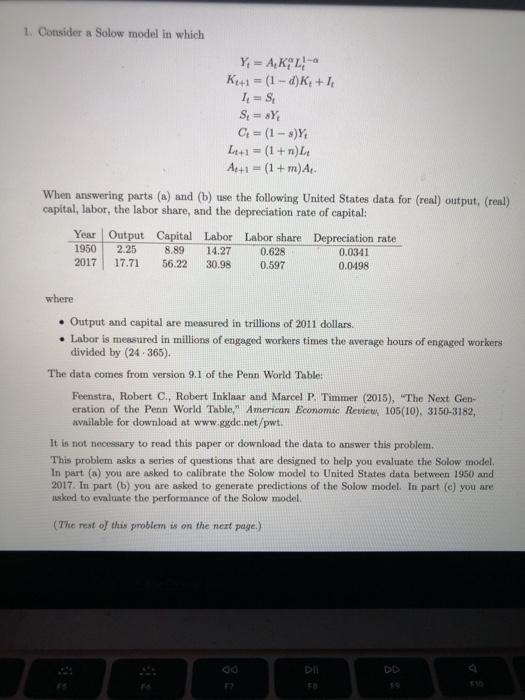
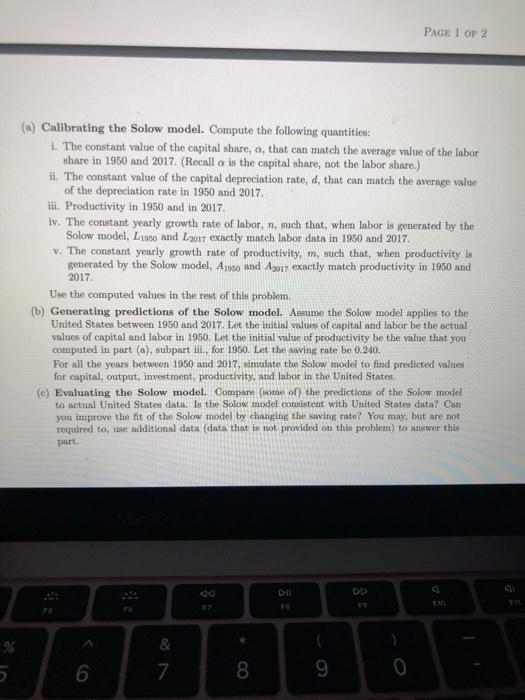
1. Consider a Solow model in which Y = A.KL K+1-(1-2); +1 I=S S=Y C = (1 - 3) L+1-(1 + r) Ae+1 = (1 + m)A When answering parts (@) and (b) use the following United States data for (real) output, (real) capital, labor, the labor share, and the depreciation rate of capital: Year Output Capital Labor Labor share Depreciation rate 1950 2.25 8.89 14.27 0.628 0.0341 2017 17.71 56.22 30.98 0.597 0.0498 where Output and capital are measured in trillions of 2011 dollars. Labor is measured in millions of engaged workers times the average hours of engaged workers divided by 24.365). The data comes from version 9.1 of the Penn World Table: Feenstra, Robert C., Robert Inklaar and Marcel P. Timmer (2015), "The Next Gen- eration of the Penn World Table American Economic Review, 105(10), 3150-3182, available for download at www.ggde.net/pwt. It is not necessary to read this paper or download the data to answer this problem, This problem asks a series of questions that are designed to help you evaluate the Solow model In part (8) you are asked to calibrate the Solow model to United States date between 1950 and 2017. In part (b) you are asked to generate predictions of the Solow model. In part (e) you are sked to evaluate the performance of the Solow model (The rest of this problem is on the next page.) PAGE 1 OF 2 (s) Calibrating the Solow model. Compute the following quantities: 1. The constant value of the capital share, a, that can match the average value of the labor share in 1950 and 2017. (Recall a is the capital share, not the labor share.) H. The constant value of the capital depreciation rate, d, that can match the average value of the depreciation rate in 1950 and 2017 iii. Productivity in 1950 and in 2017. iv. The constant yearly growth rate of labor, n, such that, when labor is generated by the Solow model, L1950 and 2017 exactly match labor data in 1950 and 2017. v. The constant yearly growth rate of productivity, m, such that, when productivity is generated by the Solow model. As and 1017 exactly match productivity in 1950 and 2017 Use the computed values in the rest of this problem, (b) Generating predictions of the Solow model. Assume the Solow model applies to the United States between 1950 and 2017. Let the initial values of capital and labor be the actual values of capital and labor in 1950. Let the initial value of productivity be the value that you computed in part (a), subpart iii., for 1950. Let the saving rate be 0.240. For all the years between 1950 and 2017, simulate the Salow model to find predicted values for capital, output, investment, productivity, and labor in the United States () Evaluating the Solow model. Compare some of the predictions of the Solow model to actual United States data. Is the Solow model consistent with United States data? Con you improve the fit of the Solow model by changing the saving rate? You may, but are not required to use additional data (data that is not provided on this problem) to answer this part & 6 7 8 9 1. Consider a Solow model in which Y = A.KL K+1-(1-2); +1 I=S S=Y C = (1 - 3) L+1-(1 + r) Ae+1 = (1 + m)A When answering parts (@) and (b) use the following United States data for (real) output, (real) capital, labor, the labor share, and the depreciation rate of capital: Year Output Capital Labor Labor share Depreciation rate 1950 2.25 8.89 14.27 0.628 0.0341 2017 17.71 56.22 30.98 0.597 0.0498 where Output and capital are measured in trillions of 2011 dollars. Labor is measured in millions of engaged workers times the average hours of engaged workers divided by 24.365). The data comes from version 9.1 of the Penn World Table: Feenstra, Robert C., Robert Inklaar and Marcel P. Timmer (2015), "The Next Gen- eration of the Penn World Table American Economic Review, 105(10), 3150-3182, available for download at www.ggde.net/pwt. It is not necessary to read this paper or download the data to answer this problem, This problem asks a series of questions that are designed to help you evaluate the Solow model In part (8) you are asked to calibrate the Solow model to United States date between 1950 and 2017. In part (b) you are asked to generate predictions of the Solow model. In part (e) you are sked to evaluate the performance of the Solow model (The rest of this problem is on the next page.) PAGE 1 OF 2 (s) Calibrating the Solow model. Compute the following quantities: 1. The constant value of the capital share, a, that can match the average value of the labor share in 1950 and 2017. (Recall a is the capital share, not the labor share.) H. The constant value of the capital depreciation rate, d, that can match the average value of the depreciation rate in 1950 and 2017 iii. Productivity in 1950 and in 2017. iv. The constant yearly growth rate of labor, n, such that, when labor is generated by the Solow model, L1950 and 2017 exactly match labor data in 1950 and 2017. v. The constant yearly growth rate of productivity, m, such that, when productivity is generated by the Solow model. As and 1017 exactly match productivity in 1950 and 2017 Use the computed values in the rest of this problem, (b) Generating predictions of the Solow model. Assume the Solow model applies to the United States between 1950 and 2017. Let the initial values of capital and labor be the actual values of capital and labor in 1950. Let the initial value of productivity be the value that you computed in part (a), subpart iii., for 1950. Let the saving rate be 0.240. For all the years between 1950 and 2017, simulate the Salow model to find predicted values for capital, output, investment, productivity, and labor in the United States () Evaluating the Solow model. Compare some of the predictions of the Solow model to actual United States data. Is the Solow model consistent with United States data? Con you improve the fit of the Solow model by changing the saving rate? You may, but are not required to use additional data (data that is not provided on this problem) to answer this part & 6 7 8 9
Step by Step Solution
There are 3 Steps involved in it

Get step-by-step solutions from verified subject matter experts