

Question: Look at lines 2, 9, and 16, and answer the following questions: 1. Has recent real private nonresidential fixed investment been volatile (as measured by
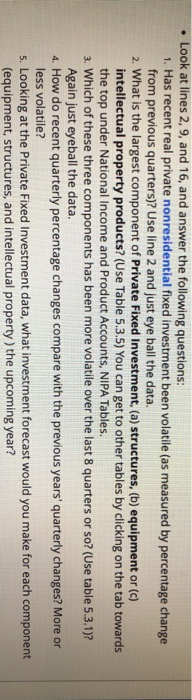
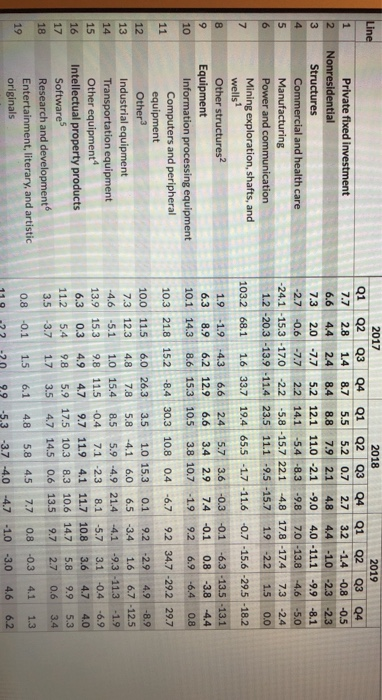
Look at lines 2, 9, and 16, and answer the following questions: 1. Has recent real private nonresidential fixed investment been volatile (as measured by percentage change from previous quarters)? Use line 2 and just eye ball the data. 2. What is the largest component of Private Fixed Investment, (a) structures, (b) equipment or (c) intellectual property products? (Use Table 5.3.5) You can get to other tables by clicking on the tab towards the top under National Income and Product Accounts, NIPA Tables. 3. Which of these three components has been more volatile over the last 8 quarters or so? (Use table 5.3.1)? Again just eyeball the data. 4. How do recent quarterly percentage changes compare with the previous years' quarterly changes? More or less volatile? 5. Looking at the Private Fixed Investment data, what investment forecast would you make for each component (equipment, structures, and intellectual property) the upcoming year? Line Private fixed investment Nonresidential Structures Commercial and health care Manufacturing Power and communication Mining exploration, shafts, and wells 1 Other structures Equipment Information processing equipment Computers and peripheral equipment Other Industrial equipment Transportation equipment Other equipment Intellectual property products Software Research and development Entertainment, literary, and artistic originals 2017 2018 2019 Q1 Q2 Q3 Q4 Q1 Q2 Q3 04 01 02 03 04 2.8 1.4 8.7 5.5 5.2 0.7 2.7 3.2 -14 -0.8 -0.5 6.6 4.4 24 8.4 8.8 7.9 2.1 4.8 44 -10 -2.3 -23 7.3 2.0 -7.7 5.2 12.1 11.0 -2.1 -9.0 4.0 -11.1 -9.9 -8.1 -2.7 -0.6 -7.7 2.2 14.1 -5.4 -8.3 -9.8 7.0 -13.8 4.6 -5.0 -24.1 -15.3 -17.0 -2.2 -5.8 -15.7 22.1 4.8 17.8 -174 7.3 1.2 -20.3 -13.9 -11.4 23.5 11.1 -9.5 -15.7 1.9 -2.2 1.5 0.0 103.2 68.1 1.6 33.7 19.4 65.5 -1.7 -11.6 -0.7 -15.6 -29.5 -18.2 1.9 -1.9 -4.3 6.6 2.4 5.7 3.6 -0.3 -0.1 -6.3 -13.5 -13.1 6.3 8.9 6.2 12.9 6.6 3.4 2.9 7.4 -0.1 0.8 -3.8 -4.4 10.1 14.3 8.6 15.3 10.5 3.8 10.7 -1.9 9.2 6.9 -6.4 0.8 10,3 21.8 15.2 -8.4 30.3 10.8 0.4 -6.7 9.2 34.7 -29.2 29.7 10.0 11.5 6.0 26.3 3.5 1.0 15.3 0.1 9.2 -2.9 4.9 -8.9 1.6 6.7 -12.5 5.9 -4.9 21.4 -4.1 -9.3 -11.3 -1.9 13.9 15.3 9.8 11.5 -0.4 7.1 -23 8.1 -5.7 3.1 -0.4 -6.9 6.3 0.3 4.9 4.7 9.7 11.9 4.1 11.7 10.8 3.6 47 4.0 11.2 54 98 5.9 17.5 10.3 5.8 9.9 5.3 3.5 -3.7 17 3.5 4.7 14.5 9.7 2.7 0.6 3.4 0.8 0.1 1.5 6.1 -0.3 4.1 1.3 -5,3 -3.7 4.0 -4.7 -1.0 -3.0 4.6 6.2 119 Look at lines 2, 9, and 16, and answer the following questions: 1. Has recent real private nonresidential fixed investment been volatile (as measured by percentage change from previous quarters)? Use line 2 and just eye ball the data. 2. What is the largest component of Private Fixed Investment, (a) structures, (b) equipment or (c) intellectual property products? (Use Table 5.3.5) You can get to other tables by clicking on the tab towards the top under National Income and Product Accounts, NIPA Tables. 3. Which of these three components has been more volatile over the last 8 quarters or so? (Use table 5.3.1)? Again just eyeball the data. 4. How do recent quarterly percentage changes compare with the previous years' quarterly changes? More or less volatile? 5. Looking at the Private Fixed Investment data, what investment forecast would you make for each component (equipment, structures, and intellectual property) the upcoming year? Line Private fixed investment Nonresidential Structures Commercial and health care Manufacturing Power and communication Mining exploration, shafts, and wells 1 Other structures Equipment Information processing equipment Computers and peripheral equipment Other Industrial equipment Transportation equipment Other equipment Intellectual property products Software Research and development Entertainment, literary, and artistic originals 2017 2018 2019 Q1 Q2 Q3 Q4 Q1 Q2 Q3 04 01 02 03 04 2.8 1.4 8.7 5.5 5.2 0.7 2.7 3.2 -14 -0.8 -0.5 6.6 4.4 24 8.4 8.8 7.9 2.1 4.8 44 -10 -2.3 -23 7.3 2.0 -7.7 5.2 12.1 11.0 -2.1 -9.0 4.0 -11.1 -9.9 -8.1 -2.7 -0.6 -7.7 2.2 14.1 -5.4 -8.3 -9.8 7.0 -13.8 4.6 -5.0 -24.1 -15.3 -17.0 -2.2 -5.8 -15.7 22.1 4.8 17.8 -174 7.3 1.2 -20.3 -13.9 -11.4 23.5 11.1 -9.5 -15.7 1.9 -2.2 1.5 0.0 103.2 68.1 1.6 33.7 19.4 65.5 -1.7 -11.6 -0.7 -15.6 -29.5 -18.2 1.9 -1.9 -4.3 6.6 2.4 5.7 3.6 -0.3 -0.1 -6.3 -13.5 -13.1 6.3 8.9 6.2 12.9 6.6 3.4 2.9 7.4 -0.1 0.8 -3.8 -4.4 10.1 14.3 8.6 15.3 10.5 3.8 10.7 -1.9 9.2 6.9 -6.4 0.8 10,3 21.8 15.2 -8.4 30.3 10.8 0.4 -6.7 9.2 34.7 -29.2 29.7 10.0 11.5 6.0 26.3 3.5 1.0 15.3 0.1 9.2 -2.9 4.9 -8.9 1.6 6.7 -12.5 5.9 -4.9 21.4 -4.1 -9.3 -11.3 -1.9 13.9 15.3 9.8 11.5 -0.4 7.1 -23 8.1 -5.7 3.1 -0.4 -6.9 6.3 0.3 4.9 4.7 9.7 11.9 4.1 11.7 10.8 3.6 47 4.0 11.2 54 98 5.9 17.5 10.3 5.8 9.9 5.3 3.5 -3.7 17 3.5 4.7 14.5 9.7 2.7 0.6 3.4 0.8 0.1 1.5 6.1 -0.3 4.1 1.3 -5,3 -3.7 4.0 -4.7 -1.0 -3.0 4.6 6.2 119
Step by Step Solution
There are 3 Steps involved in it

Get step-by-step solutions from verified subject matter experts