

Question: (Look at provided graph below) Between points A and B the marginal product of labor is: a. falling. b. zero. c. increasing. d. constant. e.

(Look at provided graph below) Between points A and B the marginal product of labor is:
a. falling.
b. zero. c. increasing. d. constant. e. infinite.
(Look at provided graph below) As units of labor are hired between quantities L1 and L2, ________ is ________ and ________ is ________. a. total product; rising; marginal product; negative b. total product; rising; average product; negative
c. total product; rising; marginal product; positive
d. marginal product; zero; total product; falling e. marginal product; rising; total product; constant
(Look at provided graph below) Hiring L2 units of labor results in total product attaining a ________and the marginal product of labor ________.
a. minimum; falling, but still being positive b. maximum; being negative
c. maximum; being positive
d. minimum; being equal to zero
e. maximum; being equal to zero
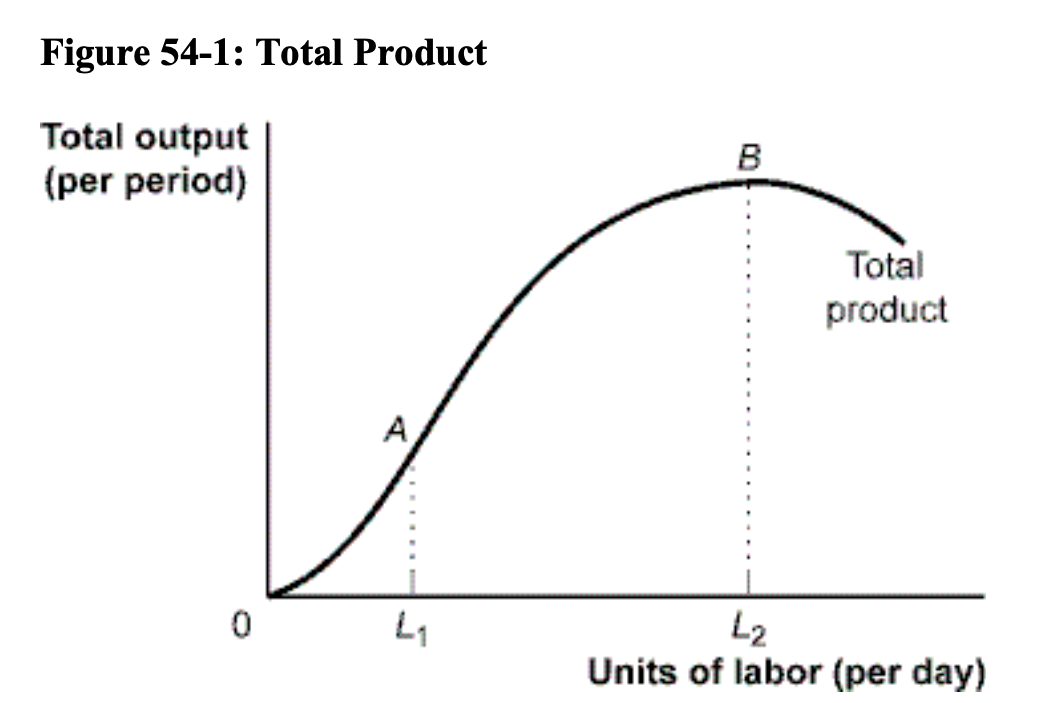
Figure 54-1: Total Product Total output (per period) 0 L1 L2 Units of labor (per day)
Step by Step Solution
There are 3 Steps involved in it

Get step-by-step solutions from verified subject matter experts