

Look at the accompanying FastTrack, which shows the results for Round1 for a Foundation industry. Answer...
Fantastic news! We've Found the answer you've been seeking!
Question:
Transcribed Image Text:
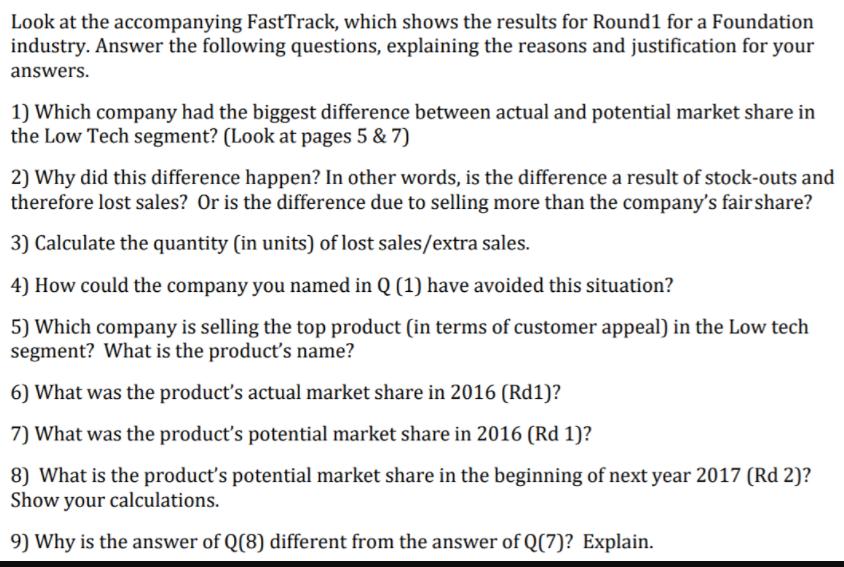
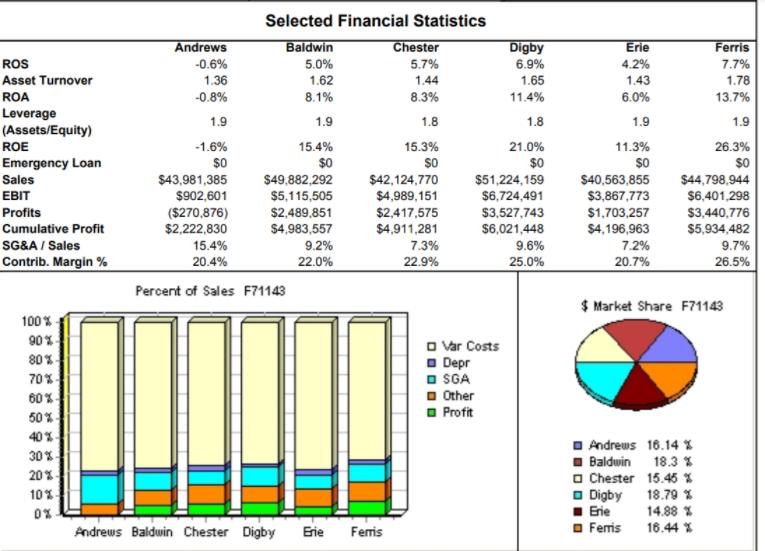
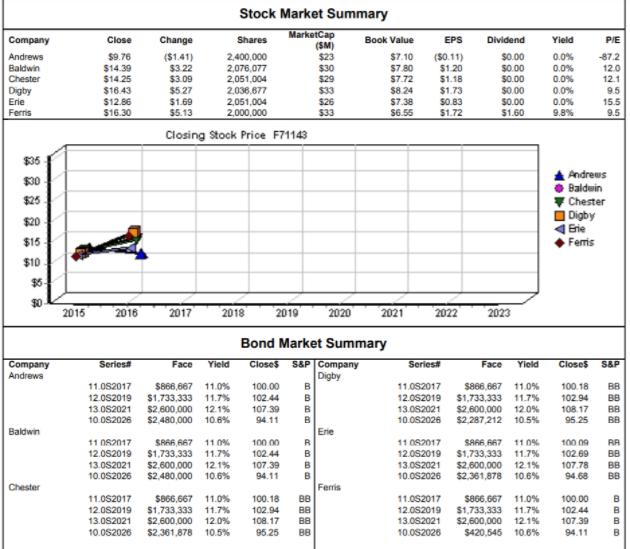
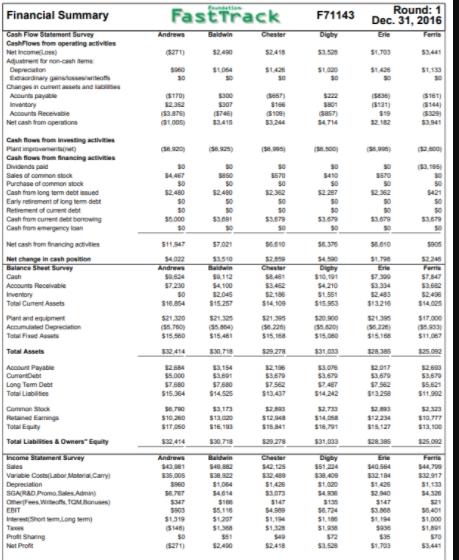
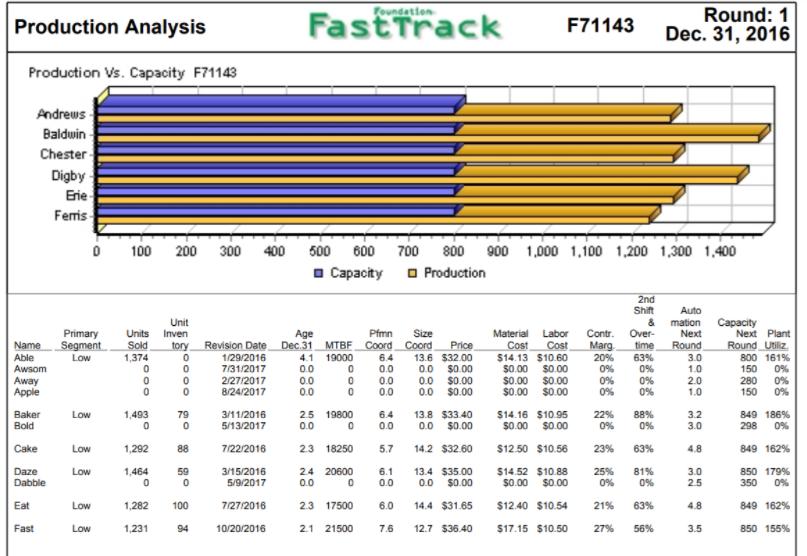
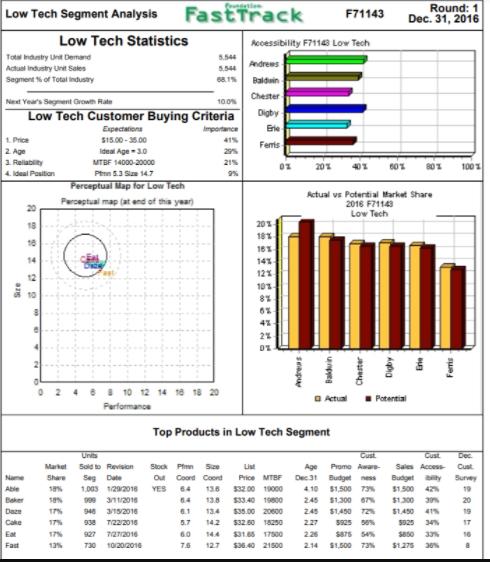
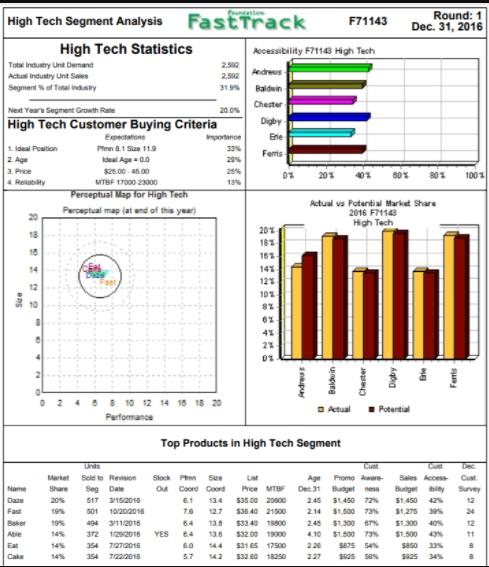
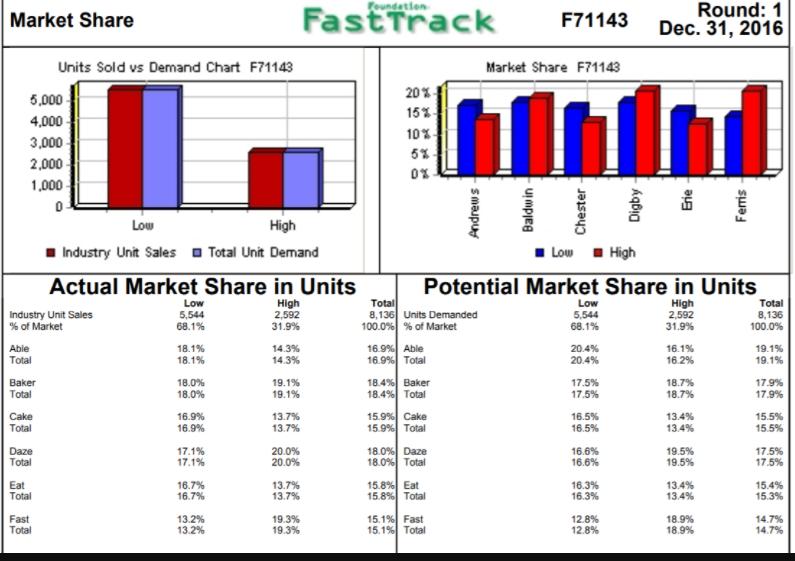
Look at the accompanying FastTrack, which shows the results for Round1 for a Foundation industry. Answer the following questions, explaining the reasons and justification for your answers. 1) Which company had the biggest difference between actual and potential market share in the Low Tech segment? (Look at pages 5 & 7) 2) Why did this difference happen? In other words, is the difference a result of stock-outs and therefore lost sales? Or is the difference due to selling more than the company's fair share? 3) Calculate the quantity (in units) of lost sales/extra sales. 4) How could the company you named in Q (1) have avoided this situation? 5) Which company is selling the top product (in terms of customer appeal) in the Low tech segment? What is the product's name? 6) What was the product's actual market share in 2016 (Rd1)? 7) What was the product's potential market share in 2016 (Rd 1)? 8) What is the product's potential market share in the beginning of next year 2017 (Rd 2)? Show your calculations. 9) Why is the answer of Q(8) different from the answer of Q(7)? Explain. ROS Asset Turnover ROA Leverage (Assets/Equity) ROE Emergency Loan Sales EBIT Profits Cumulative Profit SG&A / Sales Contrib. Margin % 100% 90% 80% 70%- 60%- 50%- 40%- 30%- 20%- 10%- 0% Andrews -0.6% 1.36 -0.8% 1.9 -1.6% $0 $43,981,385 $902,601 ($270,876) $2,222,830 Selected Financial Statistics Baldwin 5.0% 1.62 8.1% 1.9 15.4% $0 $49,882,292 $5,115,505 $2,489,851 $4,983,557 15.4% 20.4% Percent of Sales F71143 9.2% 22.0% Chester 5.7% 1.44 8.3% 1.8 15.3% $0 $42,124,770 $4,989,151 $2,417,575 $4,911,281 Andrews Baldwin Chester Digby Erie Ferris 7.3% 22.9% Digby 6.9% 1.65 11.4% 1.8 21.0% $0 $51,224,159 $6,724,491 $3,527,743 $6,021,448 □ Var Costs Depr ☐SGA □ Other Profit 9.6% 25.0% Erie 4.2% 1.43 6.0% 1.9 11.3% $0 $40,563,855 $3,867,773 $1,703,257 $4,196,963 7.2% 20.7% □ Digby ■ Erie Ferris 7.7% 1.78 13.7% 1.9 Andrews 16.14 % Baldwin 18.3 % Chester 15.45 % 18.79 % 14.88 % 16.44 % Ferris 26.3% $0 $44,798,944 $6,401,298 $3,440,776 $5,934,482 $ Market Share F71143 9.7% 26.5% Company Andrews Baldwin Chester Digby Erie Ferris $35 $30 $25 $20 $15 $10 $5 30- Company Andrews Baldwin Chester 2015 Close $9.76 $14.39 $14.25 $16.43 $12.86 $16.30 2016 Change ($1.41) $3.22 $3.09 2017 Stock Market Summary MarketCap (SM) $23 Shares 2,400,000 2,076,077 2,051,004 2,036,677 $5.27 $1.69 2,051,004 $5.13 2,000,000 Closing Stock Price F71143 2018 2019 11.052017 $866,667 11.0% 12.082019 $1,733,333 11.7% 13.082021 $2,600,000 12.0% 10.052026 $2,361,878 10.5% Series Face Yield 11.082017 $866,667 11.0% 100.00 B 12.052019 $1,733,333 11.7% 102.44 13.0S2021 $2,600,000 12.1% 10.0S2026 $2,480,000 10.6% 107.39 94.11 11082017 $866,667 110% 100 00 12.052019 $1,733,333 11.7% 102.44 13.0S2021 $2,600,000 12.1% 107.39 10.052026 $2,480,000 10.6% 94.11 Bond Market Summary Close$ S&P Company Digby 8888 B B B R B B B $30 $29 $33 $26 $33 100.18 BB 102.94 BB 108.17 88 95.25 88 2020 Erie Book Value $7.10 $7.80 $7.72 Ferris $8.24 $7.38 $6.55 2021 EPS ($0.11) $1.20 $1.18 $1.73 $0.83 $1.72 2022 Dividend $0.00 $0.00 $0.00 $0.00 $0.00 $1.60 2023 Yield 0.0% 0.0% 0.0% 0.0% 0.0% 9.8% • 11.052017 $866,667 11.0% 12.052019 $1,733,333 11.7% 13.082021 $2,600,000 12.1% 10.0S2026 $420,545 10.6% 11082017 $866,667 11.0% 100 09 12.052019 $1,733,333 11.7% 102.69 13.0S2021 $2,600,000 12.1% 107.78 10.0S2026 $2,361,878 10.6% 94.68 P/E -87.2 12.0 12.1 Andrews Baldwin Chester Digby Erie Ferris Series# Face Yield CloseS S&P 11.082017 $866,667 11.0% 100.18 BB 12.052019 $1,733,333 11.7% 102.94 BB 13.062021 $2,600,000 12.0% 10.062026 $2,287,212 10.5% BB 108.17 95.25 BB 9.5 15.5 9.5 100.00 102.44 107.39 94.11 RR BB BB BB BEEB Financial Summary Cash Flow Statement Survey Cashflows from operating activities Net Income) Adjustment for non-c Depreciation Exckandinåly gto Changes in curent assets and Acounts payable Inventory Accounts Receivable Net cash from operatione Cash flows from investing vi Plant improvement) Cash flows from financing activities Dividends paid Sales of common stock Purchase of common stock Cash from long term debtinued Early retirement of long term dett Retirement of curent de Cash from current debborrowing Net cash from financing activities Net change in cash position Balance Sheet Survey Cash Accounts Receivable Inventory Total Current Assets Plant and equipment Acumulated Depreciation Total Fi Total Assets Account Payable CurrentDebt Long Term Debt Total Liabilities Common Stock Rated Earrings Total Liabies & Owners Equity Income Statement Survey Sales Variable Cost(Labor Motor Carry Depreciation SGARAD Promo Sales Admin) OneFees WefTOM) EBIT Ta Pro Sharing Net Prof Fast Track Andrews (3271) 1960 (170) 12.362 (387) ($1.005) (16.920) 30 14.467 $0 $2.460 50 50 $5.000 50 $4.022 Andrews 50.624 $7.230 50 $10.854 $21,320 ($5.760) $15.560 $32.414 $2.684 $5.000 $7.000 $15.304 $6.790 $10,360 $17,050 $32,414 Andrews $43,001 $35,005 1960 M8.767 5347 1903 $1,319 (146) $0 (271) Baldwin $2,490 $1064 $300 $307 (1746) 13.415 10 3850 50 $2,480 50 $3.001 $7,021 $1,510 $0,112 $4,100 12.045 $15.257 ($5.804) $15,461 330.718 $3,154 $3.001 $7,680 $14.525 $3,173 $13,000 $16,103 $30.718 $48.882 $38.922 $1,064 34.014 $1,207 $1,308 951 $2.400 Chester $1,428 30 (3657) $166 (100) $3,244 50 8570 50 $2.362 50 50 $5,879 56.510 $2.50 58,461 $3.462 $2,186 $14.100 $21.395 (622) $15,108 $29.278 32,196 $3,679 $7.562 $13,437 $2,803 $12.948 $15.341 $29.278 Chester $42.125 $32,489 $1,426 $3.0753 $147 $4.900 $1,194 $1,328 540 $2,418 F71143 Digby $1,000 10 $801 $4,714 30 $410 so $2.287 50 30 $3.679 $6.376 $4,590 Digby $10,191 $4.210 $1.561 $15.953 $20.900 (55.620) $15,000 $31.033 $3.076 $3.679 $14,242 $2,733 $14,0 $18,791 $31.033 Digtry $51.224 $38,409 14.3 $135 $6.724 $1,100 $1.938 572 $1.528 Round: 1 Dec. 31, 2016 Erie Ferrie $1,703 $1,426 50 (563) (121) $19 8670 50 $3.679 $6.010 $1,798 Erie $7.300 $2,485 $13210 (36.22) $15.166 $28.385 12.017 $3.679 $7.562 $13.258 $2.893 $12,234 $15.127 $28.385 Erie $40.564 $32.184 $1.426 $2.940 3147 $3.008 $1,194 $936 $1.703 $1,139 ($161) ($144) (329) $3.941 (3195) $421 $3.679 $905 Farms $7.847 $3.682 $2,400 $14.025 $17.000 (35.933) $11,067 $25.092 $2.693 53.679 $5.621 $11.902 $10,777 $13,100 125.092 Farria $44,799 $32.917 $1,133 34.320 $21 50.401 $1,000 $1,801 $3,441 Production Analysis Production Vs. Capacity F71143 Andrews Baldwin Chester Digby Erie Ferris- Primary Name Segment Low Able Awsom Away Apple Baker Bold Cake Daze Dabble Eat Fast Low Low Low Low 0 Low 100 200 300 400 500 600 ■ Capacity Unit Units Inven Sold 1,374 000 1,493 0 tory Revision Date 1/29/2016 7/31/2017 0 0 2/27/2017 8/24/2017 1,292 1,464 0 0 0 79 0 88 59 0 1,282 100 1,231 94 3/11/2016 5/13/2017 7/22/2016 3/15/2016 5/9/2017 7/27/2016 10/20/2016 ooo: Age Pfmn Dec.31 MTBF Coord 4.1 19000 6.4 0.0 0.0 0.0 0.0 0.0 0.0 0 0 0 Foundation 2.5 19800 0.0 0 2.3 18250 2.4 20600 0.0 0 2.3 17500 2.1 21500 Track 6.4 0.0 5.7 6.1 0.0 Size Coord. Price 13.6 $32.00 0.0 $0.00 0.0 $0.00 0.0 $0.00 700 800 900 1,000 1,100 1,200 1,300 1,400 Production 13.8 $33.40 0.0 $0.00 14.2 $32.60 13.4 $35.00 0.0 $0.00 F71143 6.0 14.4 $31.65 7.6 12.7 $36.40 Material Labor Cost Cost $14.13 $10.60 $0.00 $0.00 $0.00 $0.00 $0.00 $0.00 $14.16 $10.95 $0.00 $0.00 $12.50 $10.56 $14.52 $10.88 $0.00 $0.00 $12.40 $10.54 $17.15 $10.50 0% 0% 0% 2nd Shift Contr. Over- Marg 20% time 22% 0% Auto & mation Next Round 3.0 1.0 2.0 1.0 63% 0% 0% 0% Round: 1 Dec. 31, 2016 88% 0% 63% 23% 25% 81% 0% 0% 21% 27% 56% 63% 899 3.2 3.0 4.8 32 05 3.0 2.5 4.8 3.5 Capacity Next Plant Round Utiliz 800 161% 150 0% 280 0% 150 0% 849 186% 298 0% 849 162 % 850 179% 350 0% 849 162% 850 155% Low Tech Segment Analysis Total Industry Unit Demand Actual Industry Unit Sales Segment of Total Industry Next Year's Segment Growth Rate 1. Price 2. Age 3. Reliability 4. Ideal Position 229292 ang Name Able Baker Daze Cake Eat Fast 10.0% Low Tech Customer Buying Criteria Expectations Importance $15.00-35.00 Low Tech Statistics 18 0 Ideal Age-3.0 MTBF 14000-20000 Phn 5.3 Size 14.7 Perceptual Map for Low Tech Perceptual map (at end of this year) 2 Fast Track Units Market Sold to Revision Seg Date 1,003 1/29/2016 099 3/11/2016 948 3/15/2016 938 7/22/2016 7/27/2016 9:27 730 10/20/2016 Share 18% 17% 17% 17% 13% 5.544 5.544 6 8 10 12 14 16 18 20 Performance 29% 21% 9% Accessibility F71143 Low Tech Andrews Baldwin Chester Digby Erie Ferris 20% 18% 16%- 14% 12% 10% 8% 6% 4%- 2% 0% seoply Stock Pn Size List Coord Coord Out YES 64 138 Price MTBF $32.00 19000 64 13.8 $33.40 19800 6.1 13.4 $35.00 20600 5.7 142 $32.60 18250 60 14.4 $31.65 17500 7.6 12.7 $36.40 21500 20% F71143 Baldin Top Products in Low Tech Segment Actual 40% Actual vs Potential Market Share 2016 F71143 Low Tech 60% Potential Cust Age Promo Awar Dec 31 Budget ness 4.10 $1,500 73% 2:45 $1,300 67% 245 $1,450 2.27 2.26 $875 54% 2.14 $1,500 73% 3925 50% Round: 1 Dec. 31, 2016 80% Cust Sales Access Budget by $1.500 42% $1.300 30% $1,450 41% 5025 34% $850 33% $1.275 30% 100% Dec. Cust Survey 19 20 19 16 a High Tech Segment Analysis Fast Track High Tech Statistics Total Industry Unit Demand Actual Industry Unit Sales Segment % of Total industry Next Year's Segment Growth Rate High Tech Customer Buying Criteria 1. Ideal Position 3. Price 4. Reliability ang Name Daze Fast Baker Able Eat 8 10 14 Expectations Pin 8.1 Size 11.9 Ideal Age=0.0 $25.00 45.00 MTBF 17000 23000 Perceptual Map for High Tech Perceptual map (at end of this year) 20% 19% Market Share Seg Date 19% 14% Unts Sold to Revision 2,592 2,502 31.9% 8 8 10 12 14 16 18 20 Performance 20.0% Importance 33% 517 3/15/2016 501 10/20/2016 404 3/11/2016 372 1/29/2016 YES 354 7/27/2016 7/22/2016 25% 13% Stock Pn Size Out Coord Coord 6.1 13.4 12.7 13.8 7.6 6.4 13.6 6.0 14.4 5.7 Accessibility F71143 High Tech Andreus Baldwin Chester Digby Ene Femis 0% 20% 18% 15%. 14% 12% 10% 8% 0% 4% 2% 0% 20% Andreus Top Products in High Tech Segment List Price MTBF $35.00 20000 $36.40 21500 $33.40 19500 $32.00 19000 Age Dec 31 2.45 2.14 2.45 4.10 2.26 $31.65 17500 $32.60 18250 F71143 Actual vs Potential Market Share 2016 F71143 High Tech Obbl Baldwin 2.27 Actual Chester 50% Potential Cust Promo Aware- Budget ness $1,450 72% $1.500 73% $1.300 67% $1.500 73% $875 54% $825 50% Round: 1 Dec. 31, 2016 80% 100% Cust Sales Access Budget ty $1,450 42% $1,275 39% $1,300 40% $1,500 43% $850 33% $825 34% Dec Cust Survey 12 24 12 11 8 Market Share 5,000 4,000 3,000 2,000 1,000 0 Able Total Baker Total Industry Unit Sales % of Market Cake Total Daze Total Units Sold vs Demand Chart F71143 Eat Total Fast Total Low High Industry Unit Sales Total Unit Demand Actual Market Share in Units High 2,592 31.9% Low 5,544 68.1% 18.1% 18.1% 18.0% 18.0% 16.9% 16.9% 17.1% 17.1% 16.7% 16.7% 13.2% 13.2% 14.3% 14.3% 19.1% 19.1% 13.7% 13.7% 20.0% 20.0% Fast Track 13.7% 13.7% 19.3% 19.3% 20%- 15%- 10%- 5% 0% Total 8,136 Units Demanded 100.0% % of Market 16.9% Able 16.9% Total Low High Potential Market Share in Units High 2,592 31.9% 18.4% Baker 18.4% Total 15.9% Cake 15.9% Total 18.0% Daze 18.0% Total 15.8% Eat 15.8% Total F71143 15.1% Fast 15.1% Total Market Share F71143 Low 5,544 68.1% 20.4% 20.4% 17.5% 17.5% 16.5% 16.5% 16.6% 16.6% 16.3% 16.3% Round: 1 Dec. 31, 2016 TI 12.8% 12.8% 16.1% 16.2% 18.7% 18.7% 13.4% 13.4% 19.5% 19.5% 13.4% 13.4% 18.9% 18.9% Total 8,136 100.0% 19.1% 19.1% 17.9% 17.9% 15.5% 15.5% 17.5% 17.5% 15.4% 15.3% 14.7% 14.7% Look at the accompanying FastTrack, which shows the results for Round1 for a Foundation industry. Answer the following questions, explaining the reasons and justification for your answers. 1) Which company had the biggest difference between actual and potential market share in the Low Tech segment? (Look at pages 5 & 7) 2) Why did this difference happen? In other words, is the difference a result of stock-outs and therefore lost sales? Or is the difference due to selling more than the company's fair share? 3) Calculate the quantity (in units) of lost sales/extra sales. 4) How could the company you named in Q (1) have avoided this situation? 5) Which company is selling the top product (in terms of customer appeal) in the Low tech segment? What is the product's name? 6) What was the product's actual market share in 2016 (Rd1)? 7) What was the product's potential market share in 2016 (Rd 1)? 8) What is the product's potential market share in the beginning of next year 2017 (Rd 2)? Show your calculations. 9) Why is the answer of Q(8) different from the answer of Q(7)? Explain. ROS Asset Turnover ROA Leverage (Assets/Equity) ROE Emergency Loan Sales EBIT Profits Cumulative Profit SG&A / Sales Contrib. Margin % 100% 90% 80% 70%- 60%- 50%- 40%- 30%- 20%- 10%- 0% Andrews -0.6% 1.36 -0.8% 1.9 -1.6% $0 $43,981,385 $902,601 ($270,876) $2,222,830 Selected Financial Statistics Baldwin 5.0% 1.62 8.1% 1.9 15.4% $0 $49,882,292 $5,115,505 $2,489,851 $4,983,557 15.4% 20.4% Percent of Sales F71143 9.2% 22.0% Chester 5.7% 1.44 8.3% 1.8 15.3% $0 $42,124,770 $4,989,151 $2,417,575 $4,911,281 Andrews Baldwin Chester Digby Erie Ferris 7.3% 22.9% Digby 6.9% 1.65 11.4% 1.8 21.0% $0 $51,224,159 $6,724,491 $3,527,743 $6,021,448 □ Var Costs Depr ☐SGA □ Other Profit 9.6% 25.0% Erie 4.2% 1.43 6.0% 1.9 11.3% $0 $40,563,855 $3,867,773 $1,703,257 $4,196,963 7.2% 20.7% □ Digby ■ Erie Ferris 7.7% 1.78 13.7% 1.9 Andrews 16.14 % Baldwin 18.3 % Chester 15.45 % 18.79 % 14.88 % 16.44 % Ferris 26.3% $0 $44,798,944 $6,401,298 $3,440,776 $5,934,482 $ Market Share F71143 9.7% 26.5% Company Andrews Baldwin Chester Digby Erie Ferris $35 $30 $25 $20 $15 $10 $5 30- Company Andrews Baldwin Chester 2015 Close $9.76 $14.39 $14.25 $16.43 $12.86 $16.30 2016 Change ($1.41) $3.22 $3.09 2017 Stock Market Summary MarketCap (SM) $23 Shares 2,400,000 2,076,077 2,051,004 2,036,677 $5.27 $1.69 2,051,004 $5.13 2,000,000 Closing Stock Price F71143 2018 2019 11.052017 $866,667 11.0% 12.082019 $1,733,333 11.7% 13.082021 $2,600,000 12.0% 10.052026 $2,361,878 10.5% Series Face Yield 11.082017 $866,667 11.0% 100.00 B 12.052019 $1,733,333 11.7% 102.44 13.0S2021 $2,600,000 12.1% 10.0S2026 $2,480,000 10.6% 107.39 94.11 11082017 $866,667 110% 100 00 12.052019 $1,733,333 11.7% 102.44 13.0S2021 $2,600,000 12.1% 107.39 10.052026 $2,480,000 10.6% 94.11 Bond Market Summary Close$ S&P Company Digby 8888 B B B R B B B $30 $29 $33 $26 $33 100.18 BB 102.94 BB 108.17 88 95.25 88 2020 Erie Book Value $7.10 $7.80 $7.72 Ferris $8.24 $7.38 $6.55 2021 EPS ($0.11) $1.20 $1.18 $1.73 $0.83 $1.72 2022 Dividend $0.00 $0.00 $0.00 $0.00 $0.00 $1.60 2023 Yield 0.0% 0.0% 0.0% 0.0% 0.0% 9.8% • 11.052017 $866,667 11.0% 12.052019 $1,733,333 11.7% 13.082021 $2,600,000 12.1% 10.0S2026 $420,545 10.6% 11082017 $866,667 11.0% 100 09 12.052019 $1,733,333 11.7% 102.69 13.0S2021 $2,600,000 12.1% 107.78 10.0S2026 $2,361,878 10.6% 94.68 P/E -87.2 12.0 12.1 Andrews Baldwin Chester Digby Erie Ferris Series# Face Yield CloseS S&P 11.082017 $866,667 11.0% 100.18 BB 12.052019 $1,733,333 11.7% 102.94 BB 13.062021 $2,600,000 12.0% 10.062026 $2,287,212 10.5% BB 108.17 95.25 BB 9.5 15.5 9.5 100.00 102.44 107.39 94.11 RR BB BB BB BEEB Financial Summary Cash Flow Statement Survey Cashflows from operating activities Net Income) Adjustment for non-c Depreciation Exckandinåly gto Changes in curent assets and Acounts payable Inventory Accounts Receivable Net cash from operatione Cash flows from investing vi Plant improvement) Cash flows from financing activities Dividends paid Sales of common stock Purchase of common stock Cash from long term debtinued Early retirement of long term dett Retirement of curent de Cash from current debborrowing Net cash from financing activities Net change in cash position Balance Sheet Survey Cash Accounts Receivable Inventory Total Current Assets Plant and equipment Acumulated Depreciation Total Fi Total Assets Account Payable CurrentDebt Long Term Debt Total Liabilities Common Stock Rated Earrings Total Liabies & Owners Equity Income Statement Survey Sales Variable Cost(Labor Motor Carry Depreciation SGARAD Promo Sales Admin) OneFees WefTOM) EBIT Ta Pro Sharing Net Prof Fast Track Andrews (3271) 1960 (170) 12.362 (387) ($1.005) (16.920) 30 14.467 $0 $2.460 50 50 $5.000 50 $4.022 Andrews 50.624 $7.230 50 $10.854 $21,320 ($5.760) $15.560 $32.414 $2.684 $5.000 $7.000 $15.304 $6.790 $10,360 $17,050 $32,414 Andrews $43,001 $35,005 1960 M8.767 5347 1903 $1,319 (146) $0 (271) Baldwin $2,490 $1064 $300 $307 (1746) 13.415 10 3850 50 $2,480 50 $3.001 $7,021 $1,510 $0,112 $4,100 12.045 $15.257 ($5.804) $15,461 330.718 $3,154 $3.001 $7,680 $14.525 $3,173 $13,000 $16,103 $30.718 $48.882 $38.922 $1,064 34.014 $1,207 $1,308 951 $2.400 Chester $1,428 30 (3657) $166 (100) $3,244 50 8570 50 $2.362 50 50 $5,879 56.510 $2.50 58,461 $3.462 $2,186 $14.100 $21.395 (622) $15,108 $29.278 32,196 $3,679 $7.562 $13,437 $2,803 $12.948 $15.341 $29.278 Chester $42.125 $32,489 $1,426 $3.0753 $147 $4.900 $1,194 $1,328 540 $2,418 F71143 Digby $1,000 10 $801 $4,714 30 $410 so $2.287 50 30 $3.679 $6.376 $4,590 Digby $10,191 $4.210 $1.561 $15.953 $20.900 (55.620) $15,000 $31.033 $3.076 $3.679 $14,242 $2,733 $14,0 $18,791 $31.033 Digtry $51.224 $38,409 14.3 $135 $6.724 $1,100 $1.938 572 $1.528 Round: 1 Dec. 31, 2016 Erie Ferrie $1,703 $1,426 50 (563) (121) $19 8670 50 $3.679 $6.010 $1,798 Erie $7.300 $2,485 $13210 (36.22) $15.166 $28.385 12.017 $3.679 $7.562 $13.258 $2.893 $12,234 $15.127 $28.385 Erie $40.564 $32.184 $1.426 $2.940 3147 $3.008 $1,194 $936 $1.703 $1,139 ($161) ($144) (329) $3.941 (3195) $421 $3.679 $905 Farms $7.847 $3.682 $2,400 $14.025 $17.000 (35.933) $11,067 $25.092 $2.693 53.679 $5.621 $11.902 $10,777 $13,100 125.092 Farria $44,799 $32.917 $1,133 34.320 $21 50.401 $1,000 $1,801 $3,441 Production Analysis Production Vs. Capacity F71143 Andrews Baldwin Chester Digby Erie Ferris- Primary Name Segment Low Able Awsom Away Apple Baker Bold Cake Daze Dabble Eat Fast Low Low Low Low 0 Low 100 200 300 400 500 600 ■ Capacity Unit Units Inven Sold 1,374 000 1,493 0 tory Revision Date 1/29/2016 7/31/2017 0 0 2/27/2017 8/24/2017 1,292 1,464 0 0 0 79 0 88 59 0 1,282 100 1,231 94 3/11/2016 5/13/2017 7/22/2016 3/15/2016 5/9/2017 7/27/2016 10/20/2016 ooo: Age Pfmn Dec.31 MTBF Coord 4.1 19000 6.4 0.0 0.0 0.0 0.0 0.0 0.0 0 0 0 Foundation 2.5 19800 0.0 0 2.3 18250 2.4 20600 0.0 0 2.3 17500 2.1 21500 Track 6.4 0.0 5.7 6.1 0.0 Size Coord. Price 13.6 $32.00 0.0 $0.00 0.0 $0.00 0.0 $0.00 700 800 900 1,000 1,100 1,200 1,300 1,400 Production 13.8 $33.40 0.0 $0.00 14.2 $32.60 13.4 $35.00 0.0 $0.00 F71143 6.0 14.4 $31.65 7.6 12.7 $36.40 Material Labor Cost Cost $14.13 $10.60 $0.00 $0.00 $0.00 $0.00 $0.00 $0.00 $14.16 $10.95 $0.00 $0.00 $12.50 $10.56 $14.52 $10.88 $0.00 $0.00 $12.40 $10.54 $17.15 $10.50 0% 0% 0% 2nd Shift Contr. Over- Marg 20% time 22% 0% Auto & mation Next Round 3.0 1.0 2.0 1.0 63% 0% 0% 0% Round: 1 Dec. 31, 2016 88% 0% 63% 23% 25% 81% 0% 0% 21% 27% 56% 63% 899 3.2 3.0 4.8 32 05 3.0 2.5 4.8 3.5 Capacity Next Plant Round Utiliz 800 161% 150 0% 280 0% 150 0% 849 186% 298 0% 849 162 % 850 179% 350 0% 849 162% 850 155% Low Tech Segment Analysis Total Industry Unit Demand Actual Industry Unit Sales Segment of Total Industry Next Year's Segment Growth Rate 1. Price 2. Age 3. Reliability 4. Ideal Position 229292 ang Name Able Baker Daze Cake Eat Fast 10.0% Low Tech Customer Buying Criteria Expectations Importance $15.00-35.00 Low Tech Statistics 18 0 Ideal Age-3.0 MTBF 14000-20000 Phn 5.3 Size 14.7 Perceptual Map for Low Tech Perceptual map (at end of this year) 2 Fast Track Units Market Sold to Revision Seg Date 1,003 1/29/2016 099 3/11/2016 948 3/15/2016 938 7/22/2016 7/27/2016 9:27 730 10/20/2016 Share 18% 17% 17% 17% 13% 5.544 5.544 6 8 10 12 14 16 18 20 Performance 29% 21% 9% Accessibility F71143 Low Tech Andrews Baldwin Chester Digby Erie Ferris 20% 18% 16%- 14% 12% 10% 8% 6% 4%- 2% 0% seoply Stock Pn Size List Coord Coord Out YES 64 138 Price MTBF $32.00 19000 64 13.8 $33.40 19800 6.1 13.4 $35.00 20600 5.7 142 $32.60 18250 60 14.4 $31.65 17500 7.6 12.7 $36.40 21500 20% F71143 Baldin Top Products in Low Tech Segment Actual 40% Actual vs Potential Market Share 2016 F71143 Low Tech 60% Potential Cust Age Promo Awar Dec 31 Budget ness 4.10 $1,500 73% 2:45 $1,300 67% 245 $1,450 2.27 2.26 $875 54% 2.14 $1,500 73% 3925 50% Round: 1 Dec. 31, 2016 80% Cust Sales Access Budget by $1.500 42% $1.300 30% $1,450 41% 5025 34% $850 33% $1.275 30% 100% Dec. Cust Survey 19 20 19 16 a High Tech Segment Analysis Fast Track High Tech Statistics Total Industry Unit Demand Actual Industry Unit Sales Segment % of Total industry Next Year's Segment Growth Rate High Tech Customer Buying Criteria 1. Ideal Position 3. Price 4. Reliability ang Name Daze Fast Baker Able Eat 8 10 14 Expectations Pin 8.1 Size 11.9 Ideal Age=0.0 $25.00 45.00 MTBF 17000 23000 Perceptual Map for High Tech Perceptual map (at end of this year) 20% 19% Market Share Seg Date 19% 14% Unts Sold to Revision 2,592 2,502 31.9% 8 8 10 12 14 16 18 20 Performance 20.0% Importance 33% 517 3/15/2016 501 10/20/2016 404 3/11/2016 372 1/29/2016 YES 354 7/27/2016 7/22/2016 25% 13% Stock Pn Size Out Coord Coord 6.1 13.4 12.7 13.8 7.6 6.4 13.6 6.0 14.4 5.7 Accessibility F71143 High Tech Andreus Baldwin Chester Digby Ene Femis 0% 20% 18% 15%. 14% 12% 10% 8% 0% 4% 2% 0% 20% Andreus Top Products in High Tech Segment List Price MTBF $35.00 20000 $36.40 21500 $33.40 19500 $32.00 19000 Age Dec 31 2.45 2.14 2.45 4.10 2.26 $31.65 17500 $32.60 18250 F71143 Actual vs Potential Market Share 2016 F71143 High Tech Obbl Baldwin 2.27 Actual Chester 50% Potential Cust Promo Aware- Budget ness $1,450 72% $1.500 73% $1.300 67% $1.500 73% $875 54% $825 50% Round: 1 Dec. 31, 2016 80% 100% Cust Sales Access Budget ty $1,450 42% $1,275 39% $1,300 40% $1,500 43% $850 33% $825 34% Dec Cust Survey 12 24 12 11 8 Market Share 5,000 4,000 3,000 2,000 1,000 0 Able Total Baker Total Industry Unit Sales % of Market Cake Total Daze Total Units Sold vs Demand Chart F71143 Eat Total Fast Total Low High Industry Unit Sales Total Unit Demand Actual Market Share in Units High 2,592 31.9% Low 5,544 68.1% 18.1% 18.1% 18.0% 18.0% 16.9% 16.9% 17.1% 17.1% 16.7% 16.7% 13.2% 13.2% 14.3% 14.3% 19.1% 19.1% 13.7% 13.7% 20.0% 20.0% Fast Track 13.7% 13.7% 19.3% 19.3% 20%- 15%- 10%- 5% 0% Total 8,136 Units Demanded 100.0% % of Market 16.9% Able 16.9% Total Low High Potential Market Share in Units High 2,592 31.9% 18.4% Baker 18.4% Total 15.9% Cake 15.9% Total 18.0% Daze 18.0% Total 15.8% Eat 15.8% Total F71143 15.1% Fast 15.1% Total Market Share F71143 Low 5,544 68.1% 20.4% 20.4% 17.5% 17.5% 16.5% 16.5% 16.6% 16.6% 16.3% 16.3% Round: 1 Dec. 31, 2016 TI 12.8% 12.8% 16.1% 16.2% 18.7% 18.7% 13.4% 13.4% 19.5% 19.5% 13.4% 13.4% 18.9% 18.9% Total 8,136 100.0% 19.1% 19.1% 17.9% 17.9% 15.5% 15.5% 17.5% 17.5% 15.4% 15.3% 14.7% 14.7%
Expert Answer:
Answer rating: 100% (QA)
Ans 1 In the low tach segment the company that has the biggest difference between actual and potenti... View the full answer

Related Book For 

Understanding Basic Statistics
ISBN: 978-1111827021
6th edition
Authors: Charles Henry Brase, Corrinne Pellillo Brase
Posted Date:
Students also viewed these accounting questions
-
The accompanying table shows a sample from poll results by The Globe and Mail Report on Business and Angus Reid, which compare CEO evaluations of the 25 top-performing firms over two years. For the...
-
Look at Figure 13.2, which shows the organizational life cycle. In which of these stages is Sir Kensingtons located? To what issues do Sir Kensingtons founders need to be particularly sensitive in...
-
Look up businesses for sale in an industry of your choice (or the industry assigned you by your professor), at a site such as www.bizbuysell.com. What kind of information does the website provide...
-
State the degree and leading coefficient of the polynomial f(x) = 4 + x = 2x 2 - 7x 3 .
-
Read the following cases. For each case, state whether the action or situation shows a violation or potential for violation of the AICPA Code of Professional Conduct, explain why, and cite the...
-
For the past three years, Rhetorix, Inc. has produced the model X100 stereo speaker. The model is in high demand, and the company can sell as many pairs as it can produce. The selling price per pair...
-
Since opening its doors in Hawaii two years ago, Oriental Trading has enjoyed tremendous success. As a wholesaler, Oriental Trading purchases textiles from Asian markets and resells them to local...
-
Charles Choi was the owner/ operator of a grocery store in California called Genes Modern Market. In addition to the sale of normal grocery items, the store cashed payroll, personal, and third- party...
-
Primary research includes sources such as magazines, public websites, books and other reports.
-
4. Distinct Items There is a list of items in the shopping cart, each having a cost associated with it. There are n items, the cost of the ith item is / dollars and m items have already been bought...
-
5. Draw the following cost behavior situations. Show Total costs on the Y-axis and the cost driver on the X-axis: (NEAT free hand sketches are fine and be sure to label the axes) a) Dr Tebbe decides...
-
Blossom adheres to ASPE. Based on the above information, and using the direct method, the cash provided by (used in) operating activities to be reported on Blossom's 2023 statement of cash flows?...
-
74. In which of the following compounds lone pair of nitrogen is not involved in resonance? 31 (1) H (4) H 75. Select the molecule in which bonds are conjugated? (1) HC=CH-CH-CH=CH2 HCC-CH (2) H H...
-
A semiconductor has a band gap EG = 0.2 eV. The Fermi level is EF = Ev+0.15 eV. mn* 0.01mo, mp* = mo, T= 300K. Use k = 8.62x10⁻⁵ eV/K. Is this semiconductor n-type or p-type? Give your reason.
-
Select two countries which have adopted differing political, economic and social policies and philosophies. Explain how and why the two countries differ in approach to society and business...
-
1. Given f(x) = 5-10x2 2x-8 All horizontal intercepts: 9 Vertical intercept: find the following: Horizontal asymptote: Vertical asymptote(s): Domain:
-
Asap . A random sample of 182 students was asked how many songs were in their digital music library and what fraction of them was legally purchased. Overall, they reported having a total of 122,717 s
-
Discuss whether responsible human resources management should apply different standards for the home company and suppliers, for developed countries and developing countries, and for large companies...
-
Given P(A) = 0.2 and P(B) = 0.4: (a) If A and B are independent events, compute P(A and B). (b) If P(A | B) = 0.1, compute P(A and B).
-
Suppose we have a binomial experiment in which success is defined to be a particular quality or attribute that interests us. (a) Suppose n = 33 and p = 0.21. Can we approximate the ^p distribution by...
-
It is costly in both time and money to go to college. Does it pay off? According to the Census Bureau, the answer is yes. The average annual income (in thousands of dollars) of a household headed by...
-
The Glendora Company has 200,000 shares of cumulative, five percent, \(\$ 100\) par value preferred stock outstanding. Last year the company failed to pay its regular dividend, but the board of...
-
Calculate the return on common stockholders' equity for Evans \& Sons for 2018 and 2019. Did the return improve from 2018 to 2019? Evans \& Sons, Inc., disclosed the following information in a recent...
-
Willis \& Company has 20 million shares of \(\$ 1\) par value common stock outstanding. The company believes that its current market price of \(\$ 100\) per share is too high and decides to execute a...

Study smarter with the SolutionInn App