

Question: Look at the chart below that shows the population adjusted opioid-related death rates for 16 Southern states from 1999-2014. Which of the following statements are
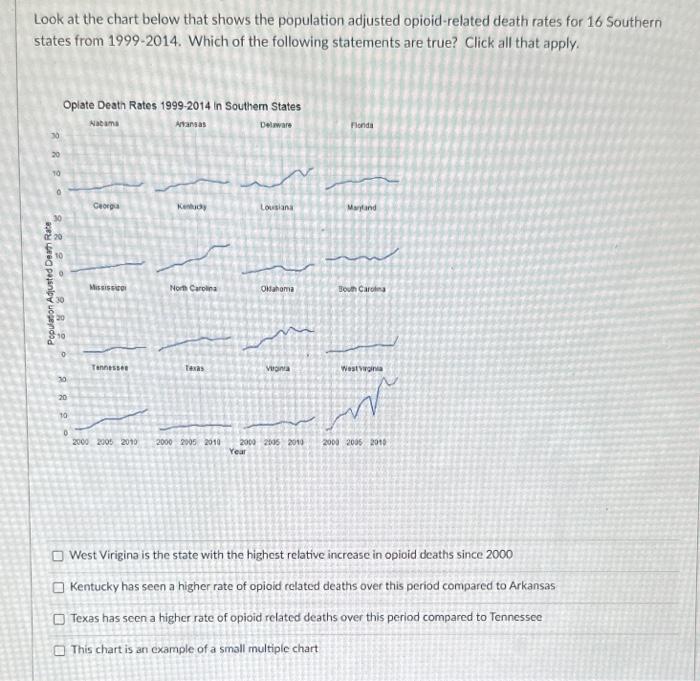
Look at the chart below that shows the population adjusted opioid-related death rates for 16 Southern states from 1999-2014. Which of the following statements are true? Click all that apply. West Virigina is the state with the highest relative increase in opioid deaths since 2000 Kentucky has seen a higher rate of opioid related deaths over this period compared to Arkansas Texas has seen a higher rate of opioid related deaths over this period compared to Tennessee This chart is an example of a small multiple chart
Step by Step Solution
There are 3 Steps involved in it
1 Expert Approved Answer
Step: 1 Unlock

Question Has Been Solved by an Expert!
Get step-by-step solutions from verified subject matter experts
Step: 2 Unlock
Step: 3 Unlock