

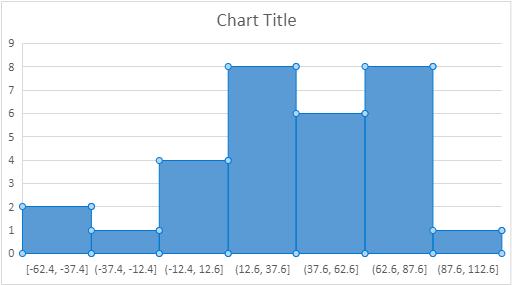
Question: look at the outlier, consider it's effect on your data set. Delete it, them from your list and see how the calculations and graphical displays.
look at the outlier, consider it's effect on your data set. Delete it, them from your list and see how the calculations and graphical displays. change
1. Considering the mean versus median and interquartile range versus standard deviation, which of these summary statistics was most affected by the Outlier?
2. which was least affected?
3. Explain why this would always be the case with a large enough data set.
4. Then restore the data to set to all the original Values.
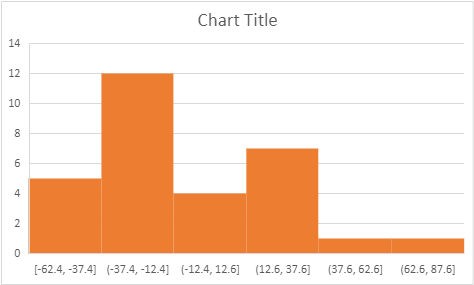
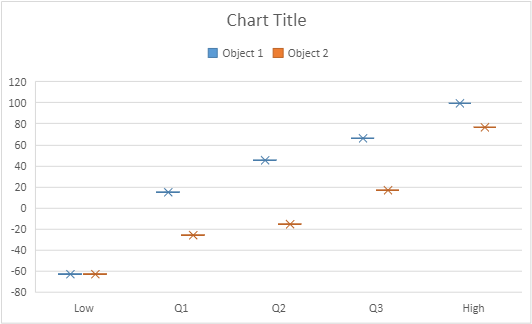
| Calculations: | Object 1 | Object 2 | Object 1 with Outlier |
| Low | -62.4 | -62.4 | -62.4 |
| Q1 | 15.25 | -25.75 | 17.5 |
| Q2 | 45 | -15 | 52.8 |
| Q3 | 66.6 | 17.25 | 67.2 |
| High | 99.6 | 76.8 | 150 |
| IQR | 51.35 | 43 | 49.7 |
| Mean | 36.58 | -6.78 | 40.23870968 |
| SD | 37.83237943 | 31.80324302 | 42.26940995 |

Step by Step Solution
There are 3 Steps involved in it
1 Expert Approved Answer
Step: 1 Unlock

Question Has Been Solved by an Expert!
Get step-by-step solutions from verified subject matter experts
Step: 2 Unlock
Step: 3 Unlock