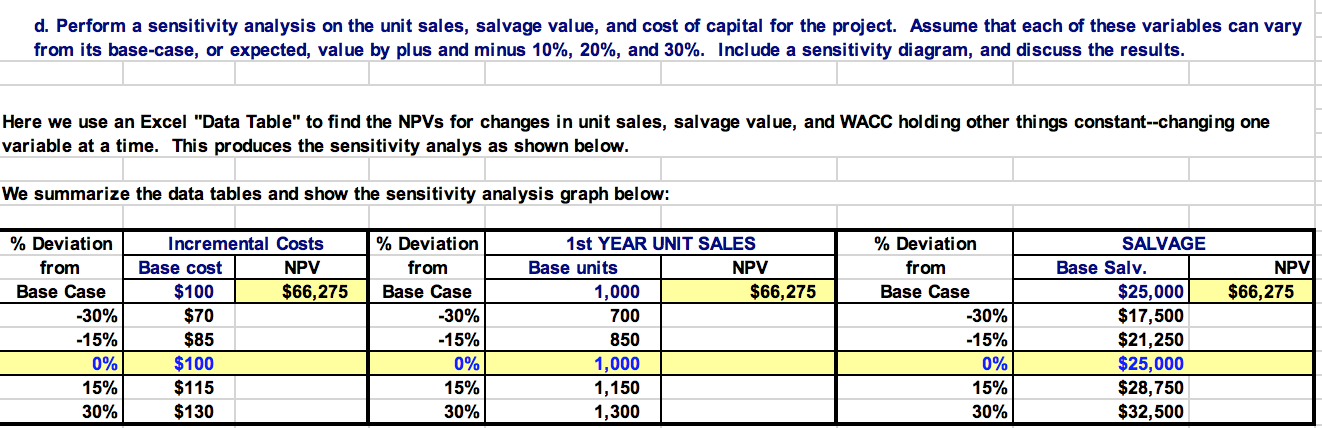
Question: look at the screenshot d. Perform a sensitivity analysis on the unit sales, salvage value, and cost of capital for the project. Assume that each

look at the screenshot

look at the screenshot d. Perform a sensitivity
d. Perform a sensitivity analysis on the unit sales, salvage value, and cost of capital for the project. Assume that each of these variables can vary from its base-case, or expected, value by plus and minus 10%, 20%, and 30%. Include a sensitivity diagram, and discuss the results. Here we use an Excel "Data Table" to nd the NPVs for changes in unit sales, salvage value, and WACC holding other things constant--changing one variable at a time. This produces the sensitivity analys as shown below. We summarize the data tables and show the sensitivity analysis graph below: % Deviation Incremental Costs % Deviation 1st YEAR UNIT SALES % Deviation SALVAGE from Base cost from Base units from Base Salv. Base Base 566,275 Base Case 1,000 $60,275 Base Case $06,275 -30% $70 -30% 700 -30% $17,500 -15% $05 -15% 050 -15% $21,250 0% $25, 000 15% 15% 1,150 15% $20,750 30% 30% 1,300 30% $32,500

Step by Step Solution

There are 3 Steps involved in it

1 Expert Approved Answer
Step: 1 Unlock blur-text-image
Question Has Been Solved by an Expert!

Get step-by-step solutions from verified subject matter experts

Step: 2 Unlock
Step: 3 Unlock

Students Have Also Explored These Related Finance Questions!