

Question: Look at the two histograms below. Each involves the same number of data. The data are all whole numbers, so the height of each bar
Look at the two histograms below. Each involves the same number of data. The data are all whole numbers, so the height of each bar represents the number of values equal to the corresponding midpoint shown on the horizontal axis. Notice that both distributions are symmetric.
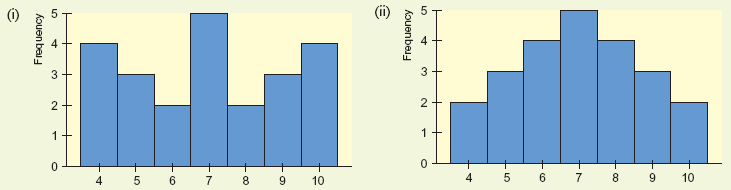
(a) Estimate the mode, median, and mean for each histogram
4 6 8 9 10 4 9 10 Frequency 4) 3. 2. kouen bei
Step by Step Solution
There are 3 Steps involved in it
1 Expert Approved Answer
Step: 1 Unlock

Explanation From the given diagram we get Mode Most freq... View full answer
Question Has Been Solved by an Expert!
Get step-by-step solutions from verified subject matter experts
Step: 2 Unlock
Step: 3 Unlock