

Question: Look at your correlation table. What is the relationship between the R-squared for each stock and the correlation between that stocks returns and the SPY
Look at your correlation table. What is the relationship between the R-squared for each stock and the correlation between that stocks returns and the SPY returns? What do these statistics tell you about the breakdown between market risk and firm-specific risk for each stock?
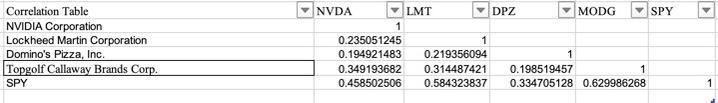
Correlation Table NVDA DPZ MODG SPY NVIDIA Corporation Lockheed Martin Corporation Domino's Pizza, Inc. \begin{tabular}{|r|r|r|r|} \hline 0.235051245 & 1 & 1 & \\ \hline 0.194921483 & 0.219356094 & 1 \\ \hline 0.349193682 & 0.314487421 & 0.198519457 & 1 \\ \hline 0.458502506 & 0.584323837 & 0.334705128 & 0.629986268 \\ \hline \end{tabular} Topgolf Callaway Brands Corp. SPY 1 Correlation Table NVDA DPZ MODG SPY NVIDIA Corporation Lockheed Martin Corporation Domino's Pizza, Inc. \begin{tabular}{|r|r|r|r|} \hline 0.235051245 & 1 & 1 & \\ \hline 0.194921483 & 0.219356094 & 1 \\ \hline 0.349193682 & 0.314487421 & 0.198519457 & 1 \\ \hline 0.458502506 & 0.584323837 & 0.334705128 & 0.629986268 \\ \hline \end{tabular} Topgolf Callaway Brands Corp. SPY 1
Step by Step Solution
There are 3 Steps involved in it

Get step-by-step solutions from verified subject matter experts