

Question: Look back to the raw data you collected in week 1. There are 7 variables listed: Vehicle type/class Year Make Model Price MPG (city) MPG
Look back to the raw data you collected in week 1. There are 7 variables listed:
Vehicle type/class
Year
Make
Model
Price
MPG (city)
MPG (highway)
Choose TWO variables that you feel are correlated and explain why you feel that they are correlated. Do you suspect the relation is positive or negative? Why? Which would be considered the independent variable, which the dependent variable? Why?
Run a regression analysis in Exceland provide the results in your post along with your raw data. Looking at theR2value, explain what this indicates about the strength of the relation.Then write out your Regression Equation, state if your p-value and conclusion.
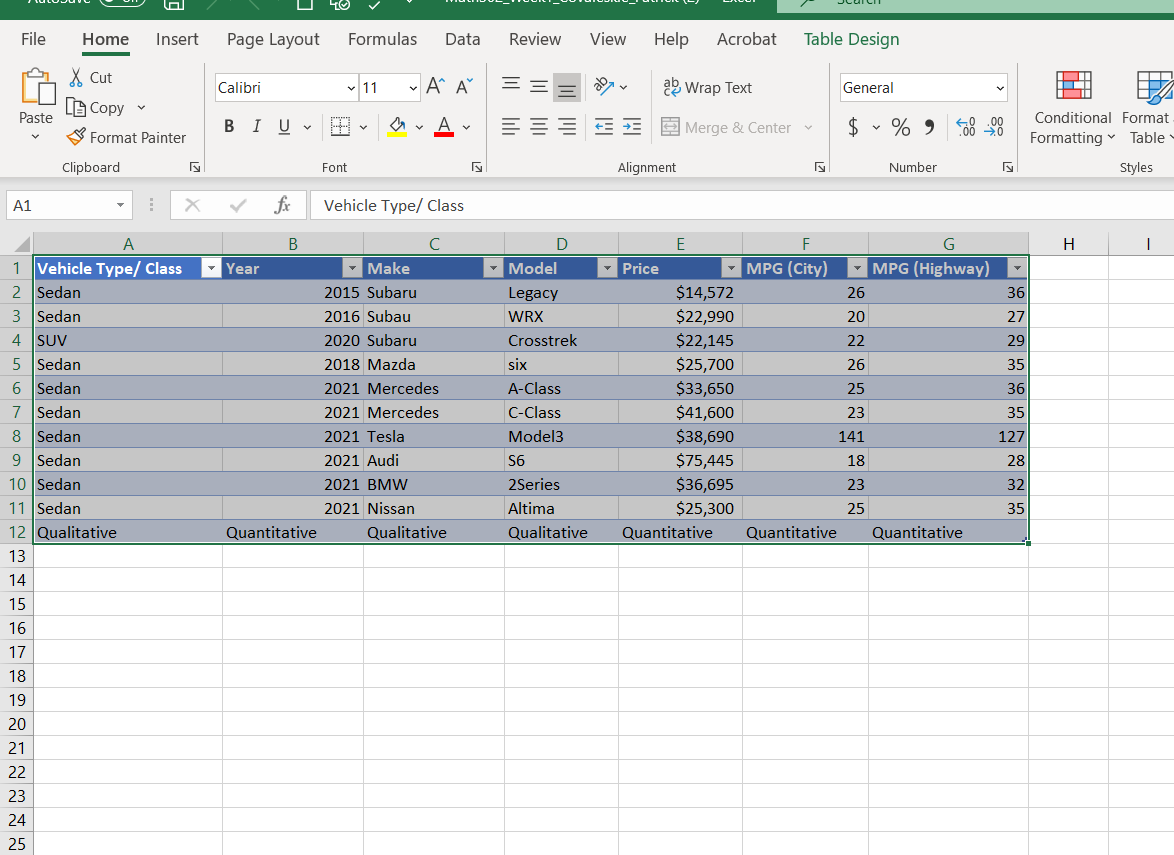
File Home Insert Page Layout Formulas Data Review View Help Acrobat Table Design X Cut AA ab Wrap Text General HT Calibri v 11 Paste LG Copy BIU Y Y Merge & Center $ ~ % " Conditional Format Format Painter Formatting * Table Clipboard Font Alignment Number Styles A1 X v fx Vehicle Type/ Class A B C D E F G H Vehicle Type/ Class Year Make Model Price MPG (City) MPG (Highway) Sedan 2015 Subaru Legacy $14,572 26 36 W N Sedan 2016 Subau WRX $22,990 20 27 SUV 2020 Subaru Crosstrek $22,145 22 29 Sedan 2018 Mazda six $25,700 26 35 Sedan 2021 Mercedes A-Class $33,650 25 36 Sedan 2021 Mercedes C-Class $41,600 23 35 Sedan 2021 Tesla Model3 $38,690 141 127 00 Sedan 2021 Audi 56 $75,445 18 28 10 Sedan 2021 BMW 2Series $36,695 23 32 11 Sedan 2021 Nissan Altima $25,300 25 35 12 Qualitative Quantitative Qualitative Qualitative Quantitative Quantitative Quantitative 13 14 15 16 17 18 19 20 21 22 23 24 25
Step by Step Solution
There are 3 Steps involved in it

Get step-by-step solutions from verified subject matter experts